

Polygon · Uniswap › DeFi
Is the liquidity mining protocol izumi a gamechanger? Why has it grown so much in Uniswap V3, and what problems does it solve?
Cover art/illustration via CryptoSlate
Launched on Bybit in December, izumi Finance is the first programmable liquidity mining protocol that optimizes liquidity allocation and enables the protocol to deliver rewards precisely and efficiently over certain price ranges. Within a week of launching on Polygon in January, its USDT/USDC pool grew to provide 70% of TVL for Uniswap.
Pledging iZi, the protocol’s token earns users veiZi, and holding veiZi earns up to 2.5x incentives in Uniswap V3 liquidity mining. In addition, it is possible to participate in the governance of the DAO by initiating votes or proposals.
In this article, we’ll explain izumi’s unique DeFi model and how the protocol managed to grow so rapidly.
How izumi Solves Uniswap V3’s Pain Points
Uniswap V3 was hailed as a huge upgrade to Uniswap because LP tokens were replaced by LP NFT for liquidity mining. The liquidity provided by LP is limited to a certain price range, from zero to infinity.
Uniswap V3 allows users to provide liquidity centrally and improve capital efficiency.
However, the cryptocurrency market is highly volatile, and most liquidity providers are unable to keep track of the price range of LPs to adjust. This leads to impermanent loss. This is one of the reasons why Uniswap V3 didn’t yet surpass Curve.
Here’s how izumi aims to solve this problem:
- Fixed Range which solves the liquidity problem for stablecoins and anchor assets in the Uniswap V3 range.
- Dynamic Range solves the problem of poor returns for liquidity providers in Uniswap V3 by allowing users to offer liquidity with a dynamic price range.
- One Side opens liquidity mining on half of the LP token (e.g. USDT) and deposits the other half (iZi) in izumi LiquidBox for staking, reducing impermanent loss.
- C-AMM Bridge is a cross-chain feature that will be launched soon. It supports multi-chain users to try Uniswap V3 LP NFT token liquidity mining, improving capital efficiency to earn higher returns.
Stats on izumi
At this point, based on data from Footprint DeFi 360 (Project Operation Data Analysis Panel), I will analyze the distribution of izumi’s TVL across different public chains and LP token pools, as well as its user data and competitors.
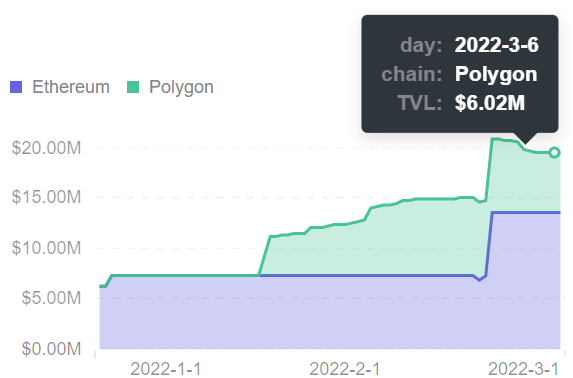
1. Distribution of TVL
izumi’s TVL is concentrated on two public chains, Ethereum and Polygon. Ethereum TVL is approximately $13 million, or 66.7%, while Polygon TVL is approximately $6.5 million, or 33.3%.
In terms of specific models, TVL is mainly provided by Liquidity Mining from both Fixed-range and Dynamic Rang models. TVL for Farming is higher than Staking (One Side).
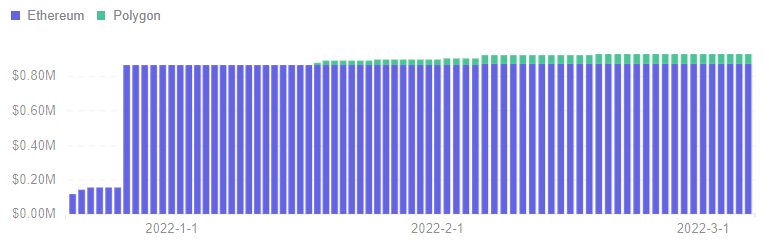
– Farming: Fixed-range & Dynamic Range
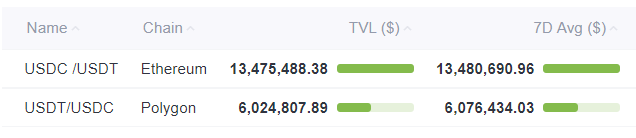
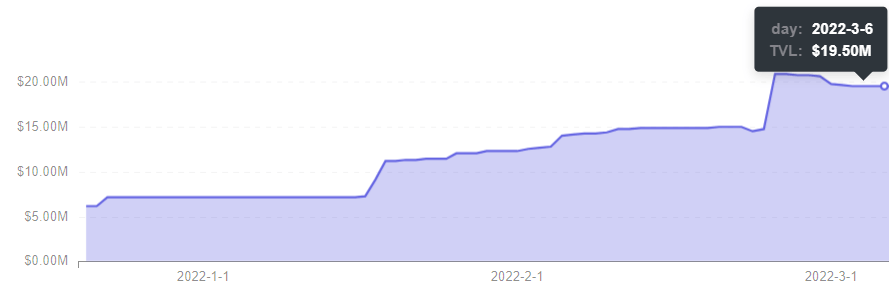
izumi has accumulated $19.50M in TVL in less than 90 days since launch. The TVL of iZUMi’s USDT/USDC farming pool on Polygon has reached $6M, which is 70%+ of the total USDT/USDC TVL on Uniswap V3 Polygon.
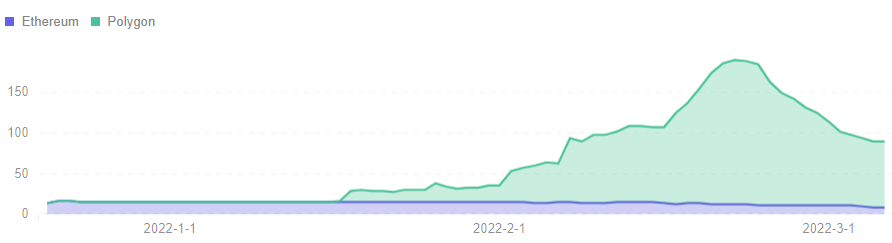
– Staking: One Side
Holding iZi can be pledged to earn rewards according to the One Side model.
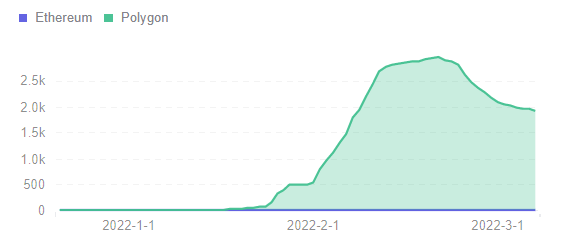
In terms of public chain distribution, iZi is mainly pledged on the Ethereum chain, which is the opposite of Farming. The main reason for this is that the Gas Fee on Polygon is lower, making it easier to take out the proceeds of liquidity mining.
In terms of the distribution of users pledging iZi, it is mainly concentrated on Polygon, with relatively few players on Ethereum.
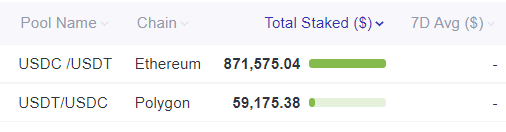
From the pool capital distribution, the USDC/USDT pool is more popular. There are more than $870,000 of iZi was pledged in Ethereum’s USDC/USDT pool.
8% of Ethereum users pledged more than 93.65% of iZi. It could be inferred that mostly Ethereum whales hold large amounts of iZi. Deposited a large capital to the model
2. User Data
In February, izumi attracted more users by posting tasks to capture flow, but the retention of users showed a small amount of churn.
In terms of on-chain distribution, fewer users on Ethereum, mainly big whales. More users on Polygon with most general players.
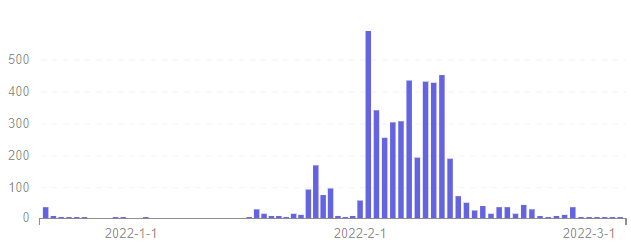
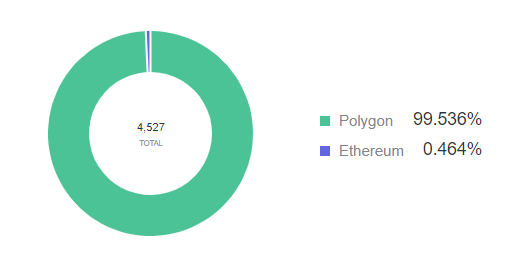
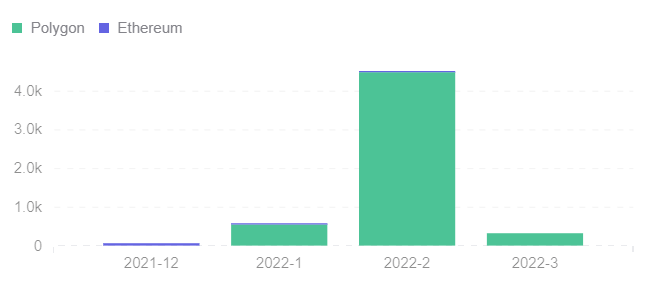
– New Addresses
As an emerging project, izumi’s overall user growth trend is up. In February, 99.54% of the growth came from Polygon.
– Active Addresses
Judging by the active addresses, users are concentrated on Polygon. Primarily, users of Polygon are quite active in February. This is roughly similar to user additions and the growth of farming.
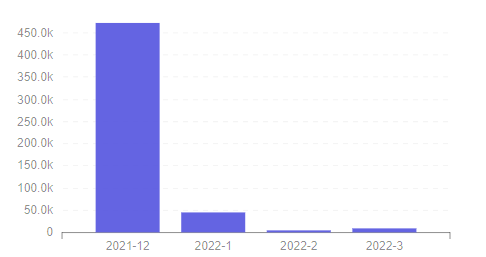
– Transactions Value Per Active Address
Monthly transactions per active address show a decreasing trend. The main volumes are the result of the whale’s activity on Ethereum in December. Since January, retail investors have been active but trading in small amounts.
3. Competitors
Uniswap V3 liquidity providers suffer from large impermanent losses—the most prominent issue today. According to a study by Topaz Blue and Bancor, more than 49% of liquidity providers lose money on their investments in 2021 due to impermanent losses.
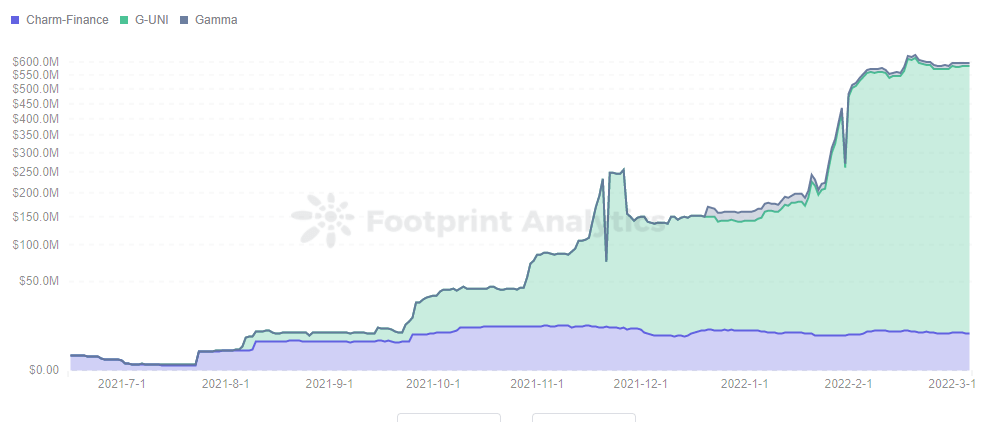
Many Uniswap V3 liquidity management protocols have emerged to address impermanent losses, not least izumi. Other examples include Alpha Vault (Charm Finance), Gamma (formerly Visor Finance), and G-UNI (Gelato Network).
– Key features of the protocols are as follows
- Alpha Vault (Charm Finance), is the first Uniswap V3 liquidity management protocol. Automating the management of liquidity rebalancing.
- G-UNI(Gelato Network) converts Uniswap V3 LP tokens NFT to replaceable LP. earning rewards by mining on Uniswap V2.
- Gamma, formerly Visor Finance, implemented active liquidity management on Uniswap V3 to reduce LP token slippage.
- izumi Finance, the first programmable Uniswap V3 mobility management protocol.
– TVL Contrast
The highest TVL protocol is G-UNI (Gelato Network) with $580 million, followed by izumi with $19.50 million. Gamma is in third with $11.17 million ahead of Alpha Vault’s $8.41 million.
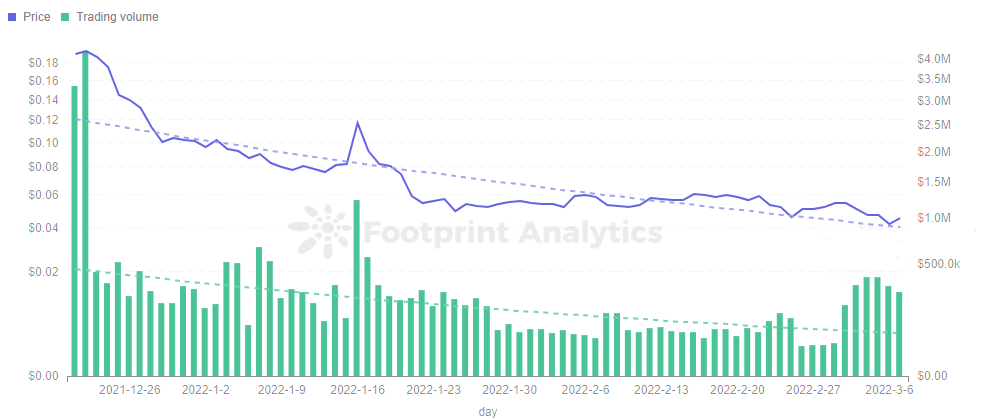
4. Token iZi
The price of iZi is trending lower, which is related to the current overall downward trend in cryptocurrencies and the impending bear market.
Token price is fluctuating around $0.05 and trading volume remains at a daily average of about $160,000.
Some thoughts
izumi’s user growth is concentrated on Polygon rather than Ethereum, and farming is still more popular than staking.
izumi could consider integrating with a public chain like Solana for a lower gas fee than Ethereum. Perhaps, the C-AMM Bridge model will be a useful innovation once it launches.
Date and Author: March 16, 2022, Grace
Data Source: Footprint Analytics izumi Finance Dashboard & Footprint DeFi 360
This piece is contributed by the Footprint Analytics community.
The Footprint Community is a place where data and crypto enthusiasts worldwide help each other understand and gain insights about Web3, the metaverse, DeFi, GameFi, or any other area of the fledgling world of blockchain. Here you’ll find active, diverse voices supporting each other and driving the community forward.
What is Footprint Analytics?
Footprint Analytics is an all-in-one analysis platform to visualize blockchain data and discover insights. It cleans and integrates on-chain data so users of any experience level can quickly start researching tokens, projects, and protocols. With over a thousand dashboard templates plus a drag-and-drop interface, anyone can build their own customized charts in minutes. Uncover blockchain data and invest smarter with Footprint.
- Footprint Website
- Discord
- Telegram
- YouTube
Get your daily recap of Bitcoin, DeFi, NFT and Web3 news from CryptoSlate
It’s free and you can unsubscribe anytime.
Get an Edge on the Crypto Market 👇
Become a member of CryptoSlate Edge and access our exclusive Discord community, more exclusive content and analysis.
On-chain analysis
Price snapshots
More context
Join now for $19/month Explore all benefits