
- Silver price may have formed a Bear Flag pattern on the 4-hour chart.
- The pattern suggests a continuation of the bearish trend to targets substantially lower.
- Support from a relic of long-term support and resistance at $25.80 is likely to provide a floor for any sell-off.
Silver (XAG/USD) price may have formed a Bear Flag pattern on the 4-hour chart which bodes ill for the precious metal’s price going forward.
4-hour Chart
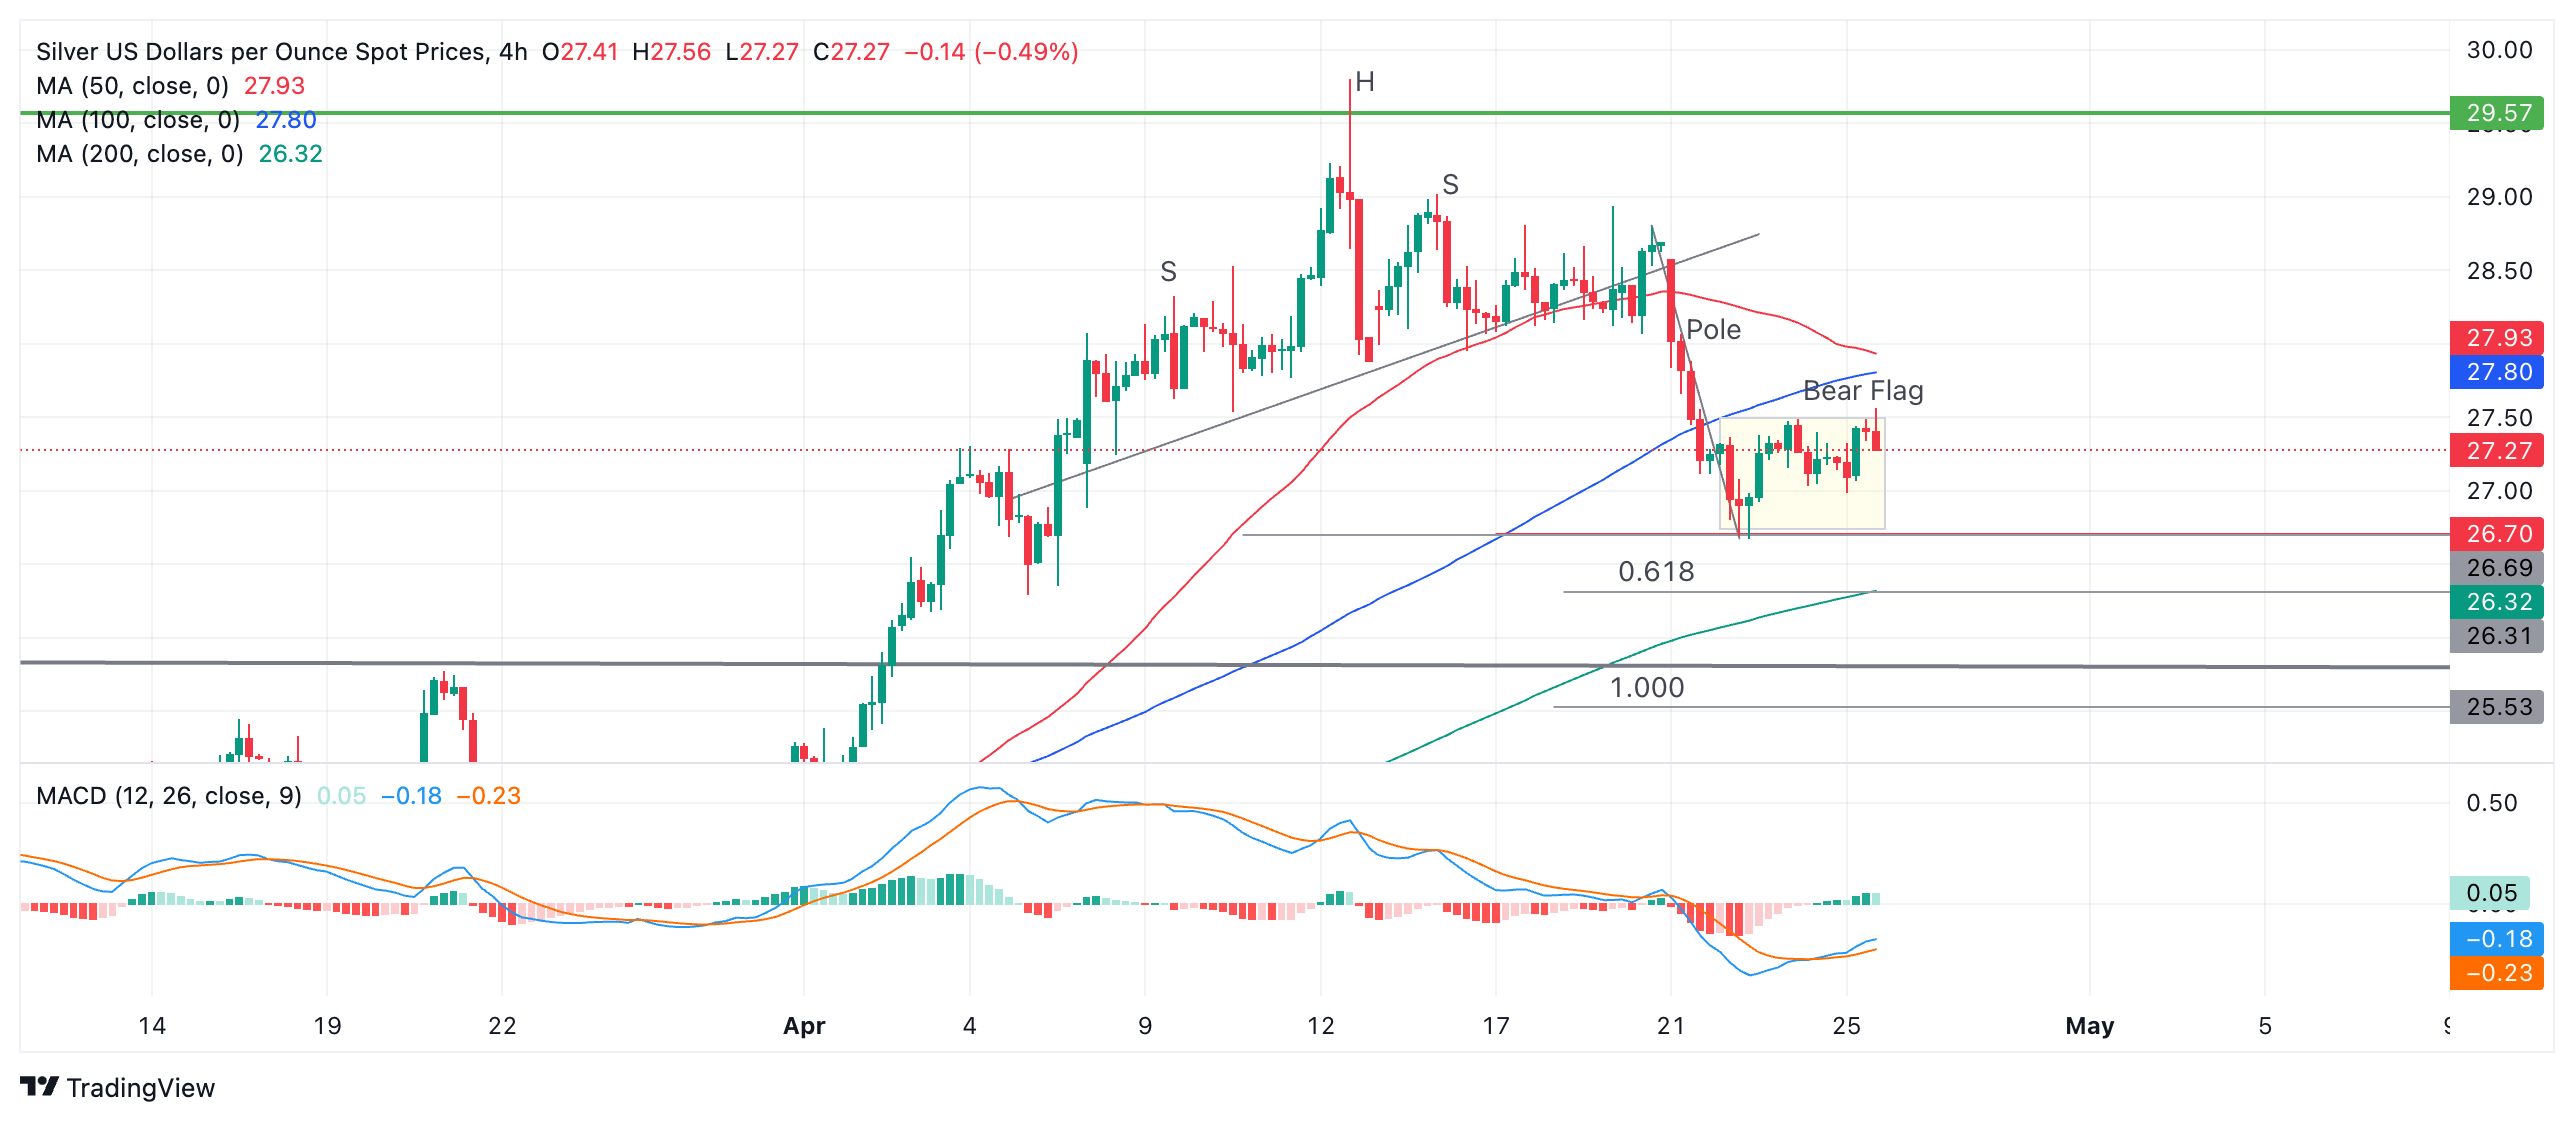
After forming a multiple shouldered Head and Shoulders (H&S) topping pattern at the $30.00 highs of mid-April, Silver price declined to the initial target for the pattern at $26.70. This target was the conservative estimate for the pattern, calculated by taking the height of the H&S and extrapolating the distance by its 0.618 Fibonacci ratio from the neckline underpinning the pattern lower.
After bouncing from a temporary floor at $26.70 Silver price has consolidated forming a rectangle pattern. Taken together with the prior sharp decline the whole formation resembles a Bear Flag pattern.
According to technical lore, the expected move down from a Bear Flag equals the length of the preceding “pole” or a Fibonacci ratio of the pole. In this case the pole is the decline that followed the completion of the H&S pattern.
The Fibonacci 0.618 ratio of the pole on Silver, when extrapolated lower, gives a conservative target at $26.31. If Silver price falls the whole length of the pole (Fib. 1.000), however, it will reach a more “optimistic” target of $25.53.
Tough support from a long-term upper range boundary line at $25.80, however, is likely to offer support before Silver price reaches the lower target for the Bear Flag.
A break below the $26.69 low of April 23 would be required to confirm a breakdown of the Bear Flag towards its targets.
Information on these pages contains forward-looking statements that involve risks and uncertainties. Markets and instruments profiled on this page are for informational purposes only and should not in any way come across as a recommendation to buy or sell in these assets. You should do your own thorough research before making any investment decisions. FXStreet does not in any way guarantee that this information is free from mistakes, errors, or material misstatements. It also does not guarantee that this information is of a timely nature. Investing in Open Markets involves a great deal of risk, including the loss of all or a portion of your investment, as well as emotional distress. All risks, losses and costs associated with investing, including total loss of principal, are your responsibility. The views and opinions expressed in this article are those of the authors and do not necessarily reflect the official policy or position of FXStreet nor its advertisers. The author will not be held responsible for information that is found at the end of links posted on this page.
If not otherwise explicitly mentioned in the body of the article, at the time of writing, the author has no position in any stock mentioned in this article and no business relationship with any company mentioned. The author has not received compensation for writing this article, other than from FXStreet.
FXStreet and the author do not provide personalized recommendations. The author makes no representations as to the accuracy, completeness, or suitability of this information. FXStreet and the author will not be liable for any errors, omissions or any losses, injuries or damages arising from this information and its display or use. Errors and omissions excepted.
The author and FXStreet are not registered investment advisors and nothing in this article is intended to be investment advice.