
- Gold retreats from all-time high of $2,758 as US 10-year Treasury yields rise, reflecting fears of higher deficit spending under a potential Trump presidency.
- The US Dollar Index (DXY) hits a two-month high at 104.50, further weighing on Gold as risk appetite shifts toward safe-haven currencies.
- Traders now price in a 92% chance of a 25 bps Fed rate cut in November with another cut expected by year-end.
Gold price plunges from all-time high of $2,758 on Wednesday as US Treasury yields climbed, while the Greenback refreshes a two-month high, according to the US Dollar Index (DXY). At the time of writing, the XAU/USD trades at $2,716, down more than 1%.
Risk appetite has deteriorated, sponsoring a flight to safe-haven currencies, but not assets like the golden metal. The US 10-year Treasury note yield has climbed over 65 basis points (bps) since the Federal Reserve (Fed) cut rates by 50 basis points (bps) on September 18, amid fears that Trump’s presidency could be inflationary.
“The yields rising are implying a pro-growth administration is potentially coming into power and there’s some fear about deficit-spending,” said Thomas Hayes, chairman at Great Hill Capital in New York.
The US 10-year T-note yields 4.248%, gaining four basis points. The DXY, which measures the performance of the US currency against another six, edges up 0.42%, at 104.50.
Market participants are pricing a 92% chance that the Fed would lower rates by 25 bps at the next meeting in November and another one in December.
Investors seem convinced that former President Donald Trump could beat Vice-President Kamala Harris, as showed by most betting websites. As we get close to the US election on November 5, investors are taking shelter in view of that possibility. Investors are somewhat worried that Trump’s deficit-spending, use of tariffs and major illegal migrant deportation scheme could cause a new bout of inflation.
In the meantime, Middle East woes have faded somewhat, a relief for commodities like Crude Oil, which is also down 0.77% to $70.69 per barrel.
Daily digest market movers: Gold price on the defensive as US yields soar
- On Thursday, US Initial Jobless Claims for the week ending October 19 are expected to rise slightly from 241K to 242K.
- The S&P Global Manufacturing PMI for October is projected to improve from 47.3 to 47.5, while the Services PMI is estimated to dip from 55.2 to 55.
- Data from the Chicago Board of Trade, based on the December fed funds rate futures contract, indicates that investors estimate 47 basis points (bps) of Fed easing by the end of the year, which is slightly lower compared to a week ago.
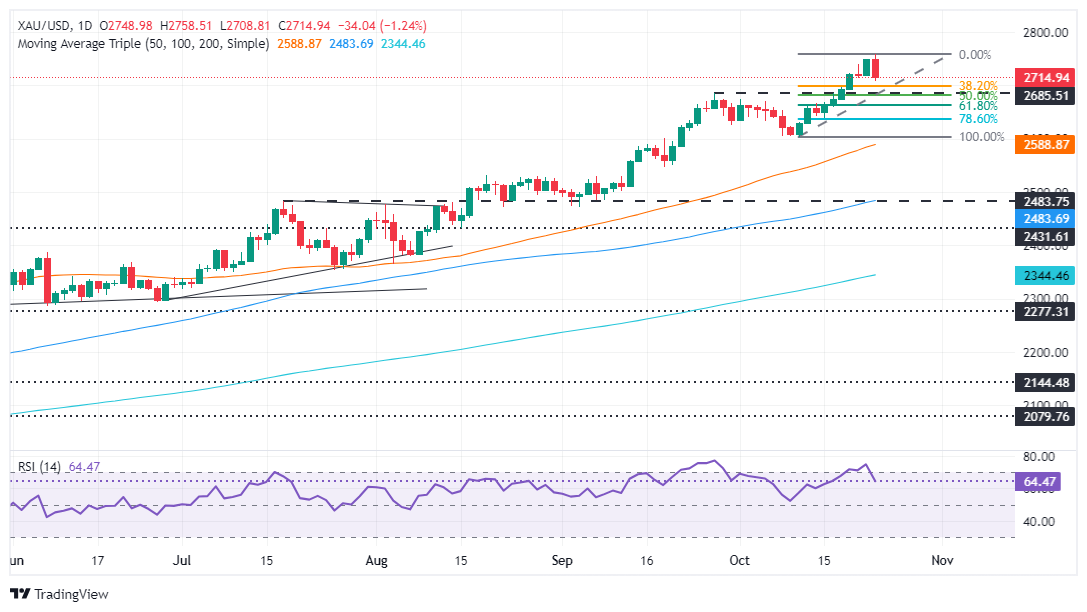
XAU/USD technical outlook: Gold price retreats below $2,720
Gold price retreats sharply, forming a Bullish Engulfing candle chart pattern or an “outside day.” If confirmed, the yellow metal could be headed for a pullback, following the 5.96% rally that started on October 10.
From a momentum standpoint, sellers are gathering some pace. The Relative Strength Index (RSI) fell sharply from overbought conditions, opening the door for further downside.
In the case of a daily close below $2,719, look for a retracement. The first support would be the 38% Fibonacci Retracement at $2,699, followed by the 50% and 61.8% Fib Retracements at $2,681 and $2,662, respectively.
On the other hand, if XAU/USD clears today’s high at $2,750 the next stop would be the all-time record high at $2,758, followed by $2,800.
Economic Indicator
Retail Sales (MoM)
The Retail Sales data, released by the US Census Bureau on a monthly basis, measures the value in total receipts of retail and food stores in the United States. Monthly percent changes reflect the rate of changes in such sales. A stratified random sampling method is used to select approximately 4,800 retail and food services firms whose sales are then weighted and benchmarked to represent the complete universe of over three million retail and food services firms across the country. The data is adjusted for seasonal variations as well as holiday and trading-day differences, but not for price changes. Retail Sales data is widely followed as an indicator of consumer spending, which is a major driver of the US economy. Generally, a high reading is seen as bullish for the US Dollar (USD), while a low reading is seen as bearish.
Read more.
Next release: Fri Nov 15, 2024 13:30
Frequency: Monthly
Consensus: –
Previous: 0.4%
Source: US Census Bureau
Retail Sales data published by the US Census Bureau is a leading indicator that gives important information about consumer spending, which has a significant impact on the GDP. Although strong sales figures are likely to boost the USD, external factors, such as weather conditions, could distort the data and paint a misleading picture. In addition to the headline data, changes in the Retail Sales Control Group could trigger a market reaction as it is used to prepare the estimates of Personal Consumption Expenditures for most goods.
Information on these pages contains forward-looking statements that involve risks and uncertainties. Markets and instruments profiled on this page are for informational purposes only and should not in any way come across as a recommendation to buy or sell in these assets. You should do your own thorough research before making any investment decisions. FXStreet does not in any way guarantee that this information is free from mistakes, errors, or material misstatements. It also does not guarantee that this information is of a timely nature. Investing in Open Markets involves a great deal of risk, including the loss of all or a portion of your investment, as well as emotional distress. All risks, losses and costs associated with investing, including total loss of principal, are your responsibility. The views and opinions expressed in this article are those of the authors and do not necessarily reflect the official policy or position of FXStreet nor its advertisers. The author will not be held responsible for information that is found at the end of links posted on this page.
If not otherwise explicitly mentioned in the body of the article, at the time of writing, the author has no position in any stock mentioned in this article and no business relationship with any company mentioned. The author has not received compensation for writing this article, other than from FXStreet.
FXStreet and the author do not provide personalized recommendations. The author makes no representations as to the accuracy, completeness, or suitability of this information. FXStreet and the author will not be liable for any errors, omissions or any losses, injuries or damages arising from this information and its display or use. Errors and omissions excepted.
The author and FXStreet are not registered investment advisors and nothing in this article is intended to be investment advice.