
- EUR/JPY slides toward 163.00, testing key support from the ascending trendline and the 200-day EMA.
- The Euro remains under pressure after Q1 GDP was revised lower despite upbeat industrial output.
- Safe-haven flows boost the Yen amid cautious risk sentiment.
EUR/JPY extended its pullback for a second consecutive session on Thursday, falling 0.5% to trade around 163.00, with the Japanese Yen (JPY) gaining traction on safe-haven flows. The Euro (EUR) also came under pressure after Eurozone growth data showed signs of moderation, prompting traders to reassess the region’s near-term outlook.
The latest economic data showed the Eurozone economy grew by 0.3% in Q1, slightly below the preliminary estimate of 0.4%, though it still marked the sixth straight quarter of expansion. Annual growth held steady at 1.2%, while Industrial Production surprised to the upside with a 2.6% MoM jump in March. Despite the industrial beat, the softer Gross Domestic Product (GDP) print keeps pressure on the European Central Bank (ECB) to maintain a dovish stance, particularly as inflation continues to ease.
The Japanese Yen draws support from broader macroeconomic and geopolitical factors. Persistent global trade uncertainties pressured the US Dollar (USD), lifting other major currencies, including the Yen. A broader rally in Asian currencies was also underway, driven by speculation that the US administration is favoring a weaker Dollar to rebalance trade flows. Washington has repeatedly argued that undervalued Asian currencies offer an unfair advantage to regional exporters. Meanwhile, attention is turning to the US-Japan trade negotiations, with Tokyo aiming to secure a deal by June.
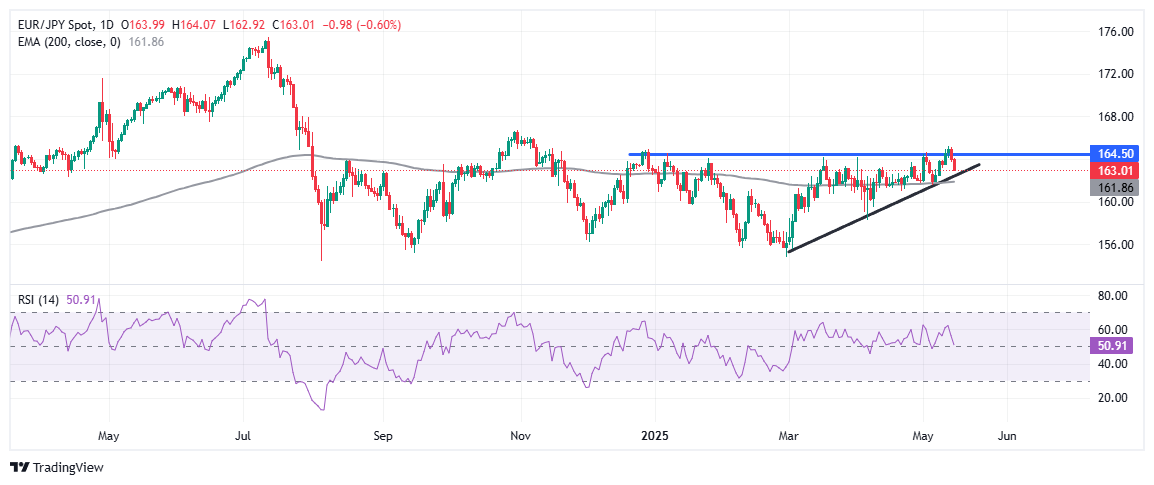
From a technical perspective, EUR/JPY is currently testing an ascending trendline from the March lows, converging with the 200-day Exponential Moving Average (EMA) at 161.86. This zone remains a key area of support. The broader structure remains intact as long as this level holds, with buyers likely to step in on dips. A sustained break below the trendline-EMA confluence would signal potential for further downside toward 160.50.
The Relative Strength Index (RSI) has eased to 50.9, hovering in neutral territory and suggesting a pause in bullish momentum rather than a full trend reversal. On the upside, 164.50 continues to cap gains, and a breakout above this level is required to resume the bullish bias.EUR/JPY remains at a critical juncture, with the 162.00–161.85 zone acting as a key technical pivot. A bounce could trigger fresh bullish momentum, but a break lower would shift the near-term bias in favor of the Yen.
Information on these pages contains forward-looking statements that involve risks and uncertainties. Markets and instruments profiled on this page are for informational purposes only and should not in any way come across as a recommendation to buy or sell in these assets. You should do your own thorough research before making any investment decisions. FXStreet does not in any way guarantee that this information is free from mistakes, errors, or material misstatements. It also does not guarantee that this information is of a timely nature. Investing in Open Markets involves a great deal of risk, including the loss of all or a portion of your investment, as well as emotional distress. All risks, losses and costs associated with investing, including total loss of principal, are your responsibility. The views and opinions expressed in this article are those of the authors and do not necessarily reflect the official policy or position of FXStreet nor its advertisers. The author will not be held responsible for information that is found at the end of links posted on this page.
If not otherwise explicitly mentioned in the body of the article, at the time of writing, the author has no position in any stock mentioned in this article and no business relationship with any company mentioned. The author has not received compensation for writing this article, other than from FXStreet.
FXStreet and the author do not provide personalized recommendations. The author makes no representations as to the accuracy, completeness, or suitability of this information. FXStreet and the author will not be liable for any errors, omissions or any losses, injuries or damages arising from this information and its display or use. Errors and omissions excepted.
The author and FXStreet are not registered investment advisors and nothing in this article is intended to be investment advice.