
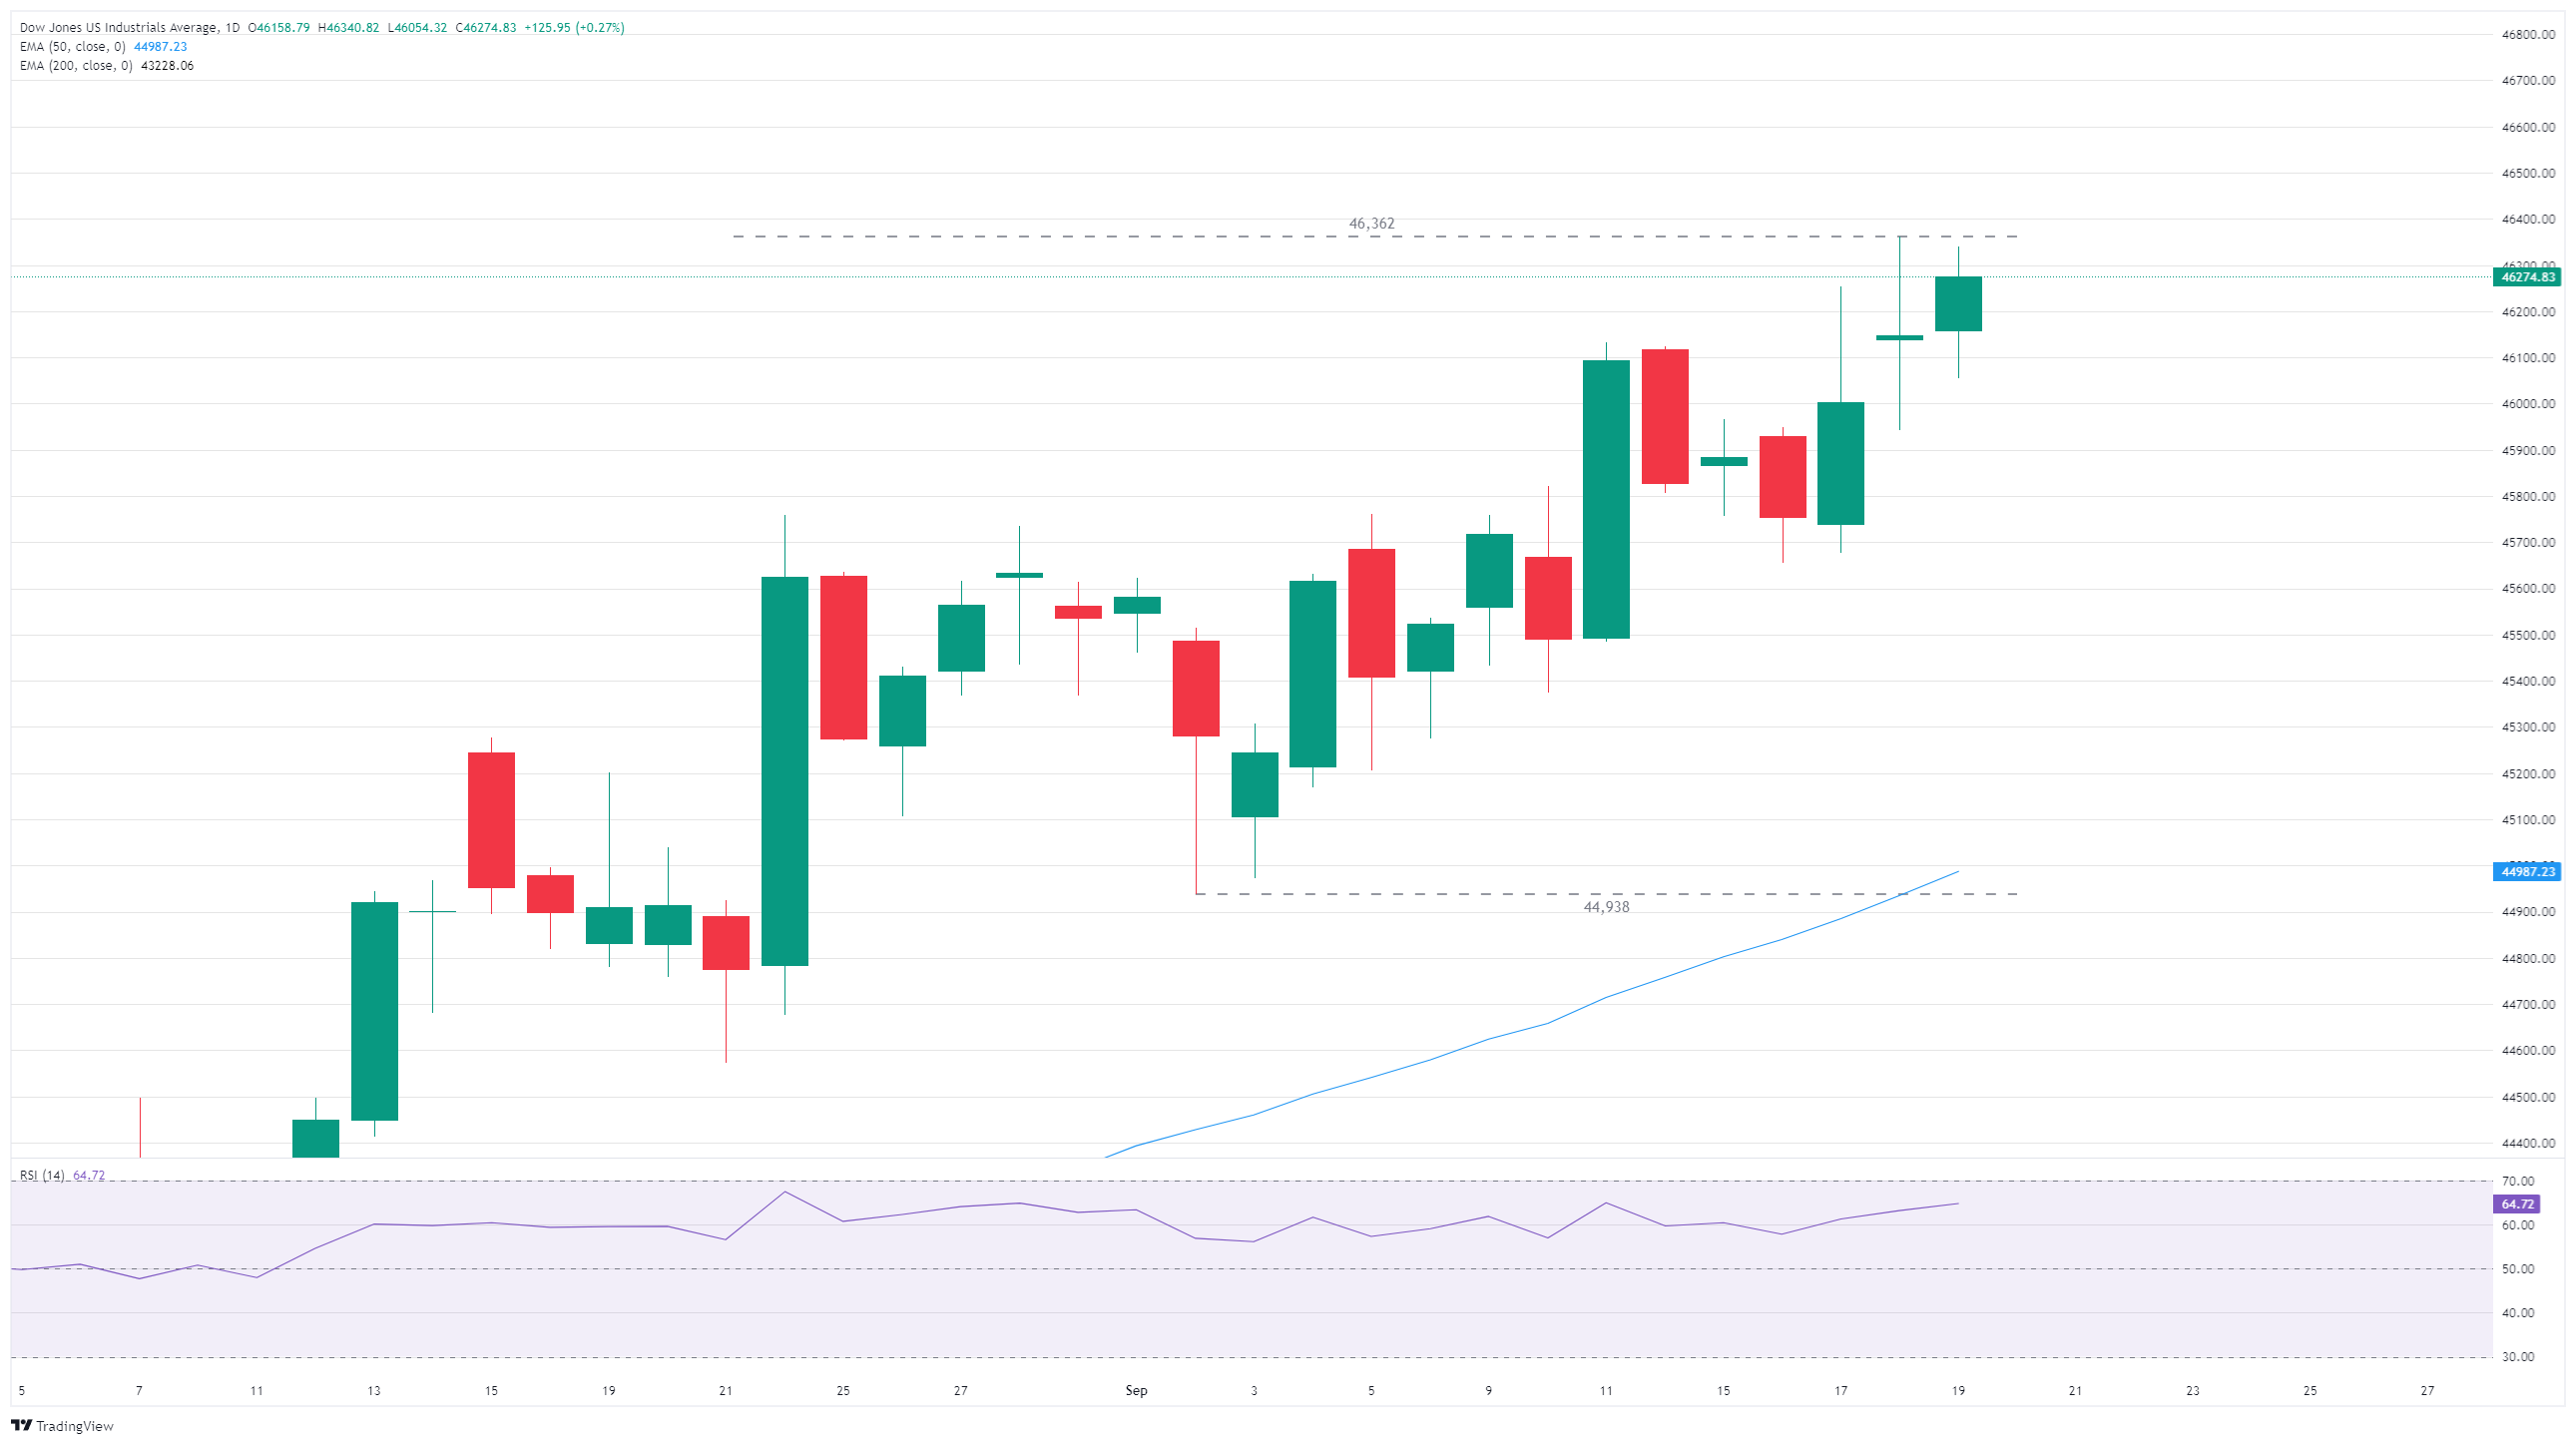
- The Dow Jones climbed into 46,250 on Friday, adding another bullish day on the backend.
- Equities have risen after the Fed trimmed interest rates through the midweek.
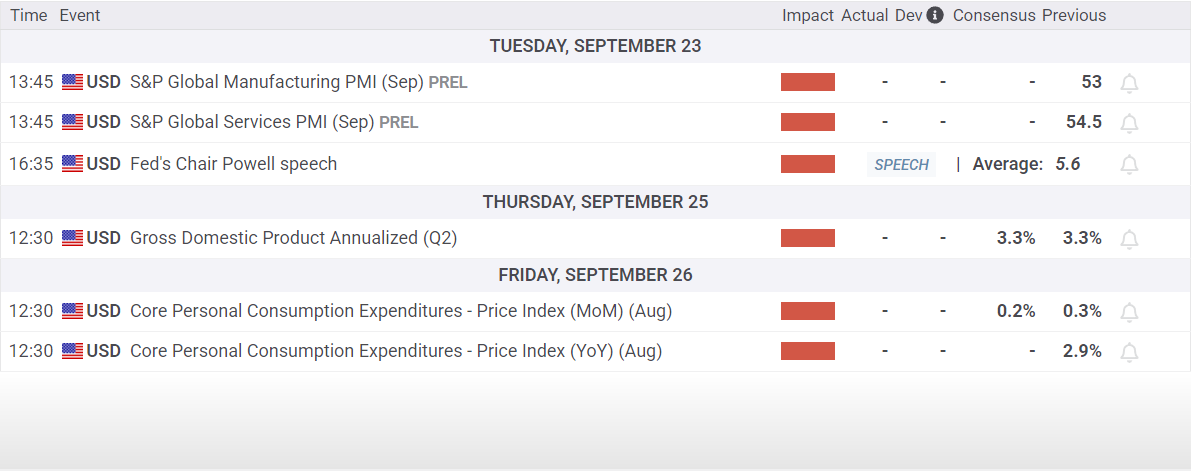
- Coming up next week: PMI survey results and another round of PCE inflation data.
The Dow Jones Industrial Average (DJIA) chalked in another slim but decisive gain on Friday, bringing the major equity index’s weekly performance to around a full percentage point gain. The Dow Jones has climbed into record highs on the back of the Federal Reserve’s (Fed) latest rate cut, and investors are positioning themselves for a series of consecutive follow-up cuts through the end of the year.
Dow climbs on Fed support
The Dow Jones has thus far put in a stellar performance, especially for late in the third quarter. While September is typically a soft season for equities, this September has bucked the trend. The Dow Jones is up over 1.6% for the month, marking in a string of high-water marks, and is on pace to close in the green for a fifth straight month.
Most sectors are on the high side for Friday, with tech stocks taking their usual place at the front of the pack, climbing 0.72% for the day. Consumer discretionary stocks took second place, rising around 0.5%, while energy stocks suffered a decline of around 1.45%.
Fresh batch of inflation data in the pipe
With the Fed’s long-awaited initial interest rate cut finally in the books, traders will have to pivot back to data watching next week. The latest round of S&P Global Purchasing Managers Index (PMI) survey results are due next Tuesday; US Gross Domestic Product (GDP) growth is scheduled for next Thursday; and an update to US Personal Consumption Expenditures Price Index (PCE) inflation is slated for next Friday.
Dow Jones daily chart
Economic Indicator
S&P Global Manufacturing PMI
The S&P Global Manufacturing Purchasing Managers Index (PMI), released on a monthly basis, is a leading indicator gauging business activity in the US manufacturing sector. The data is derived from surveys of senior executives at private-sector companies from the manufacturing sector. Survey responses reflect the change, if any, in the current month compared to the previous month and can anticipate changing trends in official data series such as Gross Domestic Product (GDP), industrial production, employment and inflation. A reading above 50 indicates that the manufacturing economy is generally expanding, a bullish sign for the US Dollar (USD). Meanwhile, a reading below 50 signals that activity in the manufacturing sector is generally declining, which is seen as bearish for USD.
Read more.
Next release:
Tue Sep 23, 2025 13:45 (Prel)
Frequency:
Monthly
Consensus:
–
Previous:
53
Source:
S&P Global
Information on these pages contains forward-looking statements that involve risks and uncertainties. Markets and instruments profiled on this page are for informational purposes only and should not in any way come across as a recommendation to buy or sell in these assets. You should do your own thorough research before making any investment decisions. FXStreet does not in any way guarantee that this information is free from mistakes, errors, or material misstatements. It also does not guarantee that this information is of a timely nature. Investing in Open Markets involves a great deal of risk, including the loss of all or a portion of your investment, as well as emotional distress. All risks, losses and costs associated with investing, including total loss of principal, are your responsibility. The views and opinions expressed in this article are those of the authors and do not necessarily reflect the official policy or position of FXStreet nor its advertisers. The author will not be held responsible for information that is found at the end of links posted on this page.
If not otherwise explicitly mentioned in the body of the article, at the time of writing, the author has no position in any stock mentioned in this article and no business relationship with any company mentioned. The author has not received compensation for writing this article, other than from FXStreet.
FXStreet and the author do not provide personalized recommendations. The author makes no representations as to the accuracy, completeness, or suitability of this information. FXStreet and the author will not be liable for any errors, omissions or any losses, injuries or damages arising from this information and its display or use. Errors and omissions excepted.
The author and FXStreet are not registered investment advisors and nothing in this article is intended to be investment advice.