
- Wall Street indexes are practically flat before the end of a strong quarter.
- Energy and Utilities are leading gains with the Tech sector lagging on portfolio adjustment moves.
- Investors’ focus is on Friday’s PCE Prices Index data and Fed Powell’s speech.
The Dow Jones Industrial Average (DJIA) is trading less than 0.1% higher on Thursday with the main Wall Street indices looking for direction in the last trading day of a strong quarter.
The DJIA edges up 0.05% in the afternoon session, reaching 39,773 on track to close the quarter with gains beyond 6%. Equity markets have been boosted by hopes of lower borrowing costs coupled with a strong economic momentum in the US, which endorses the “soft landing” rhetoric and investors’ optimism about the potential of Artificial Intelligence.
The benchmark S&P 500 is 0.07% higher, at 5,251, while the NASDAQ Composite Index drops 0.1% to 16,374.
Dow Jones news
The Energy and Utilities sectors are leading gains in the Dow Jones on Thursday with advances of 1.03% and 0.6%, respectively, while the Communication Services and Consumer Discretionary sectors, giving away 0.25% each are lagging behind.
Leading the stocks, is Walt Disney (DIS), with 1.26% gains trading at $122.5, followed closely by 3M (MMM), up 1.24% at $105.88. The big tech companies are giving away previous gains on the back of end-of-quarter portfolio adjustments, which leaves Apple (AAPL) as the biggest loser, down 0.88% to $171.81, followed by Home Depot (HD) with a 0.6% decline to $383.58.
Earlier on Thursday, the US Q4 Gross Domestic Product was upwardly revised to a 0.6% growth from the 0.4% previously estimated. Beyond that, weekly Jobless Claims declined to 210,000 from 212,000 in the week of March 22, against market expectations of an incremental move to 215,000.
The focus now is on Friday’s PCE Prices Index, which is expected to provide further clues on the Federal Reserve’s monetary policy, and the Fed Chair speech due shortly afterward.
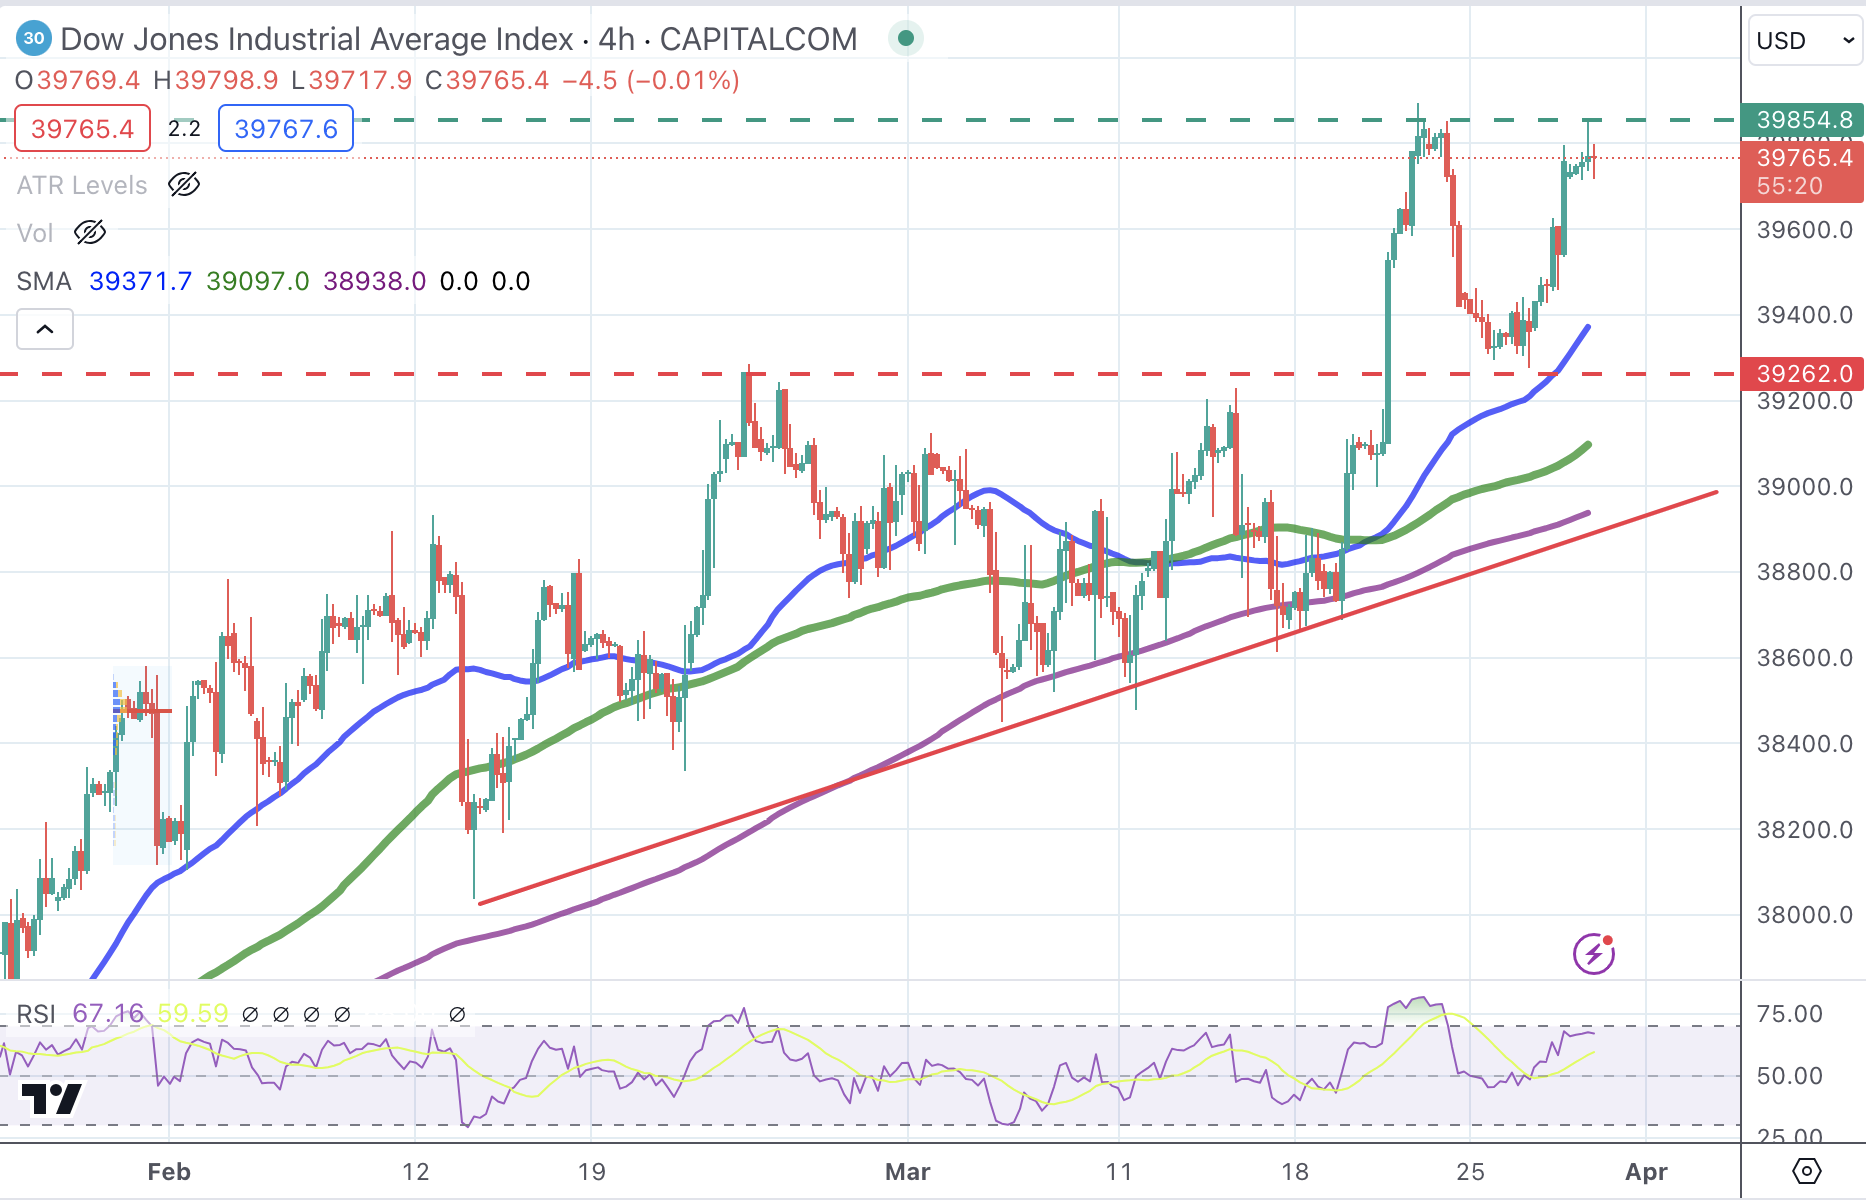
Dow Jones technical outlook
The Dow Jones Index remains bullish, standing comfortably above previous highs, and the 4-hour 50 Simple Moving Average (SMA), at 39,250. Below here, the next downside targets lie at the 39,260 level and the trendline support at 38,775.
On the upside, resistances at the 39,900 previous high and the 40,000 psychological level are likely to offer significant pushback for bulls.
Dow Jones Industrial Average 4-Hour Chart
Dow Jones FAQs
The Dow Jones Industrial Average, one of the oldest stock market indices in the world, is compiled of the 30 most traded stocks in the US. The index is price-weighted rather than weighted by capitalization. It is calculated by summing the prices of the constituent stocks and dividing them by a factor, currently 0.152. The index was founded by Charles Dow, who also founded the Wall Street Journal. In later years it has been criticized for not being broadly representative enough because it only tracks 30 conglomerates, unlike broader indices such as the S&P 500.
Many different factors drive the Dow Jones Industrial Average (DJIA). The aggregate performance of the component companies revealed in quarterly company earnings reports is the main one. US and global macroeconomic data also contributes as it impacts on investor sentiment. The level of interest rates, set by the Federal Reserve (Fed), also influences the DJIA as it affects the cost of credit, on which many corporations are heavily reliant. Therefore, inflation can be a major driver as well as other metrics which impact the Fed decisions.
Dow Theory is a method for identifying the primary trend of the stock market developed by Charles Dow. A key step is to compare the direction of the Dow Jones Industrial Average (DJIA) and the Dow Jones Transportation Average (DJTA) and only follow trends where both are moving in the same direction. Volume is a confirmatory criteria. The theory uses elements of peak and trough analysis. Dow’s theory posits three trend phases: accumulation, when smart money starts buying or selling; public participation, when the wider public joins in; and distribution, when the smart money exits.
There are a number of ways to trade the DJIA. One is to use ETFs which allow investors to trade the DJIA as a single security, rather than having to buy shares in all 30 constituent companies. A leading example is the SPDR Dow Jones Industrial Average ETF (DIA). DJIA futures contracts enable traders to speculate on the future value of the index and Options provide the right, but not the obligation, to buy or sell the index at a predetermined price in the future. Mutual funds enable investors to buy a share of a diversified portfolio of DJIA stocks thus providing exposure to the overall index.
Information on these pages contains forward-looking statements that involve risks and uncertainties. Markets and instruments profiled on this page are for informational purposes only and should not in any way come across as a recommendation to buy or sell in these assets. You should do your own thorough research before making any investment decisions. FXStreet does not in any way guarantee that this information is free from mistakes, errors, or material misstatements. It also does not guarantee that this information is of a timely nature. Investing in Open Markets involves a great deal of risk, including the loss of all or a portion of your investment, as well as emotional distress. All risks, losses and costs associated with investing, including total loss of principal, are your responsibility. The views and opinions expressed in this article are those of the authors and do not necessarily reflect the official policy or position of FXStreet nor its advertisers. The author will not be held responsible for information that is found at the end of links posted on this page.
If not otherwise explicitly mentioned in the body of the article, at the time of writing, the author has no position in any stock mentioned in this article and no business relationship with any company mentioned. The author has not received compensation for writing this article, other than from FXStreet.
FXStreet and the author do not provide personalized recommendations. The author makes no representations as to the accuracy, completeness, or suitability of this information. FXStreet and the author will not be liable for any errors, omissions or any losses, injuries or damages arising from this information and its display or use. Errors and omissions excepted.
The author and FXStreet are not registered investment advisors and nothing in this article is intended to be investment advice.