
Key takeaways:
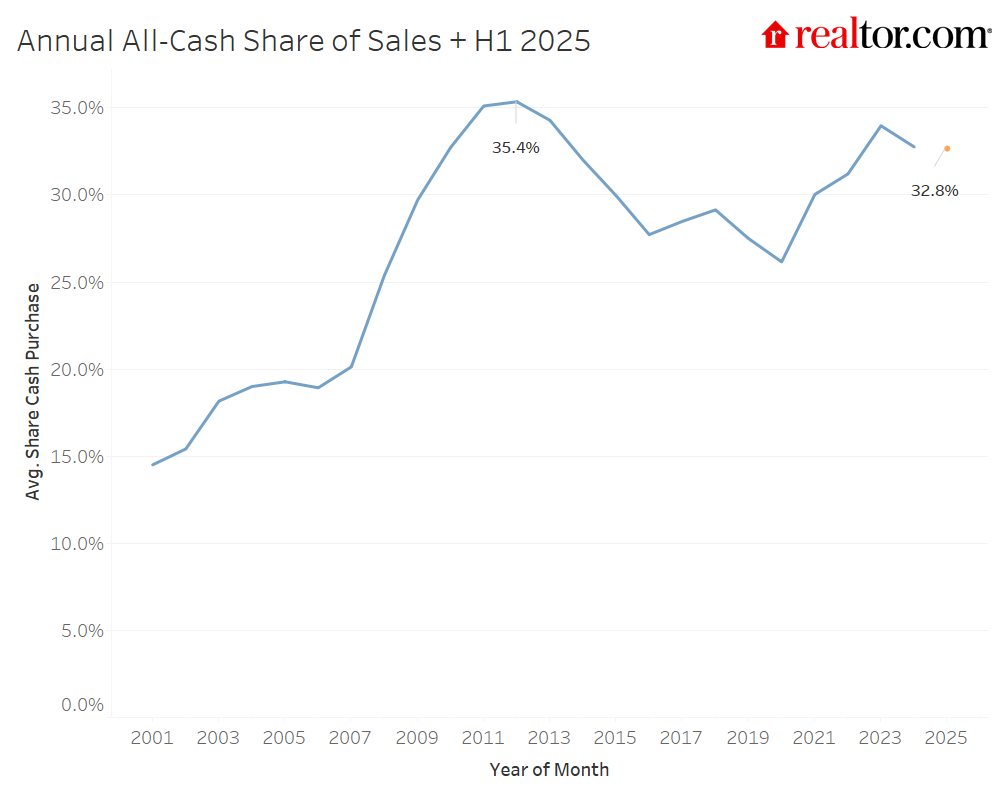
- Roughly one-third (32.8%) of homes sold in the first half of 2025 were paid for in all cash, down slightly (-0.6%) compared to the first half of 2024, but well above pre-pandemic levels. Cash sales share peaked in 2012 at 35.4%.
- Cash buyers are the most active at the low and high ends of the price spectrum.
- Lower-priced markets and popular second-home markets tend to see more all-cash sales.
- High-priced and less competitive markets tend to see a lower share of all-cash sales. Economic hubs with a high share of young households and homeowners also tend to have a lower share of all-cash purchases.
- Elevated cash activity reflects wealth concentration, investor activity, and mortgage rate avoidance.
- If rates fall, the market may rebalance toward financed buyers.
Cash sales grow with competition and mortgage rates
All-cash home purchases remain a powerful force shaping the housing market. Roughly one-third (32.8%) of homes sold in the first half of 2025 were paid for in all cash, a slight retreat (-0.6 percentage point) from the first half of 2024. Although this remains below the post–Great Recession peak (35.4% in 2012), cash buying is meaningfully higher than pre-pandemic levels, when cash buying averaged 28.6% in 2015–19. The cash buying share climbed from 2021 through 2023, before easing in 2024 and the first half of 2025.
All-cash sales are especially common at the extreme ends of the price spectrum and vary dramatically across regions. Their persistence underscores both the wealth concentration driving housing demand and the challenges faced by mortgage-dependent buyers in today’s high-cost housing market. All-cash purchases now make up a much larger share of the housing market than in the early 2000s, driven by a mix of rising investor activity, stricter lending standards, equity-rich buyers benefiting from higher home values, and intensified competition stemming from the persistent housing supply gap.
Competition and mortgage rates drive cash purchases
During the COVID-19 pandemic housing frenzy, all-cash offers became a common strategy for winning bidding wars. Cash buyers can close faster and avoid appraisal or financing contingencies, a major advantage when sellers prioritize certainty and speed. As mortgage rates climbed sharply in mid-2022, cash purchases also offered buyers a way to sidestep steep borrowing costs.
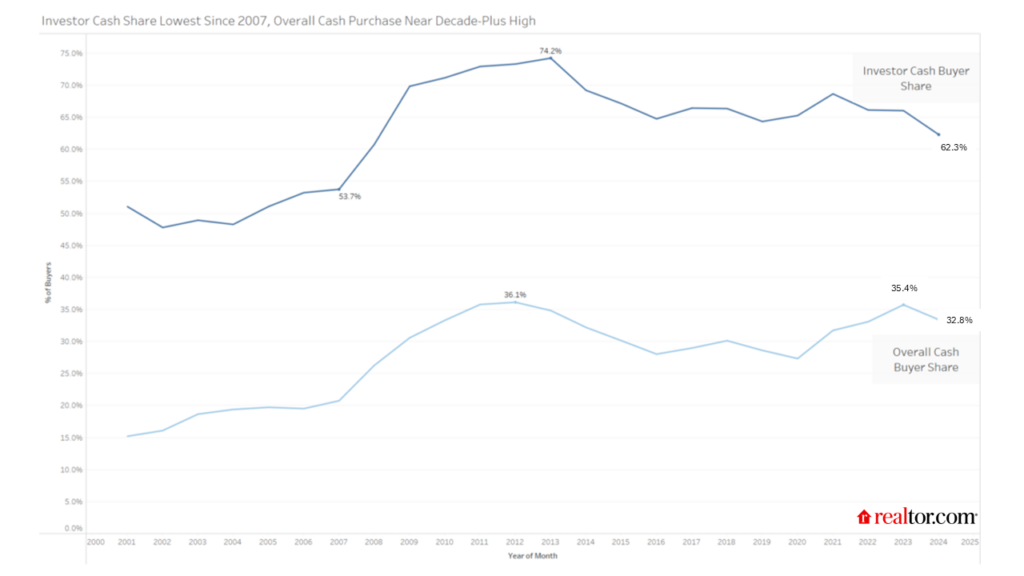
The cash share rose from 27.5% in 2019 to 31.2% in 2022, hitting a recent peak of 34% in 2023 before easing to 32.8% in 2024 and dipping further in 2025. This decline likely reflects fewer large investors, who often buy in cash, and less intense buyer competition as the market shifts toward more balance. After dominating some markets during the pandemic, large investor activity has retreated, giving way to smaller investors who more often use financing. Still, investor presence remains elevated, and with many non-investor buyers sidelined, cash purchases continue to make up a sizable share of sales.
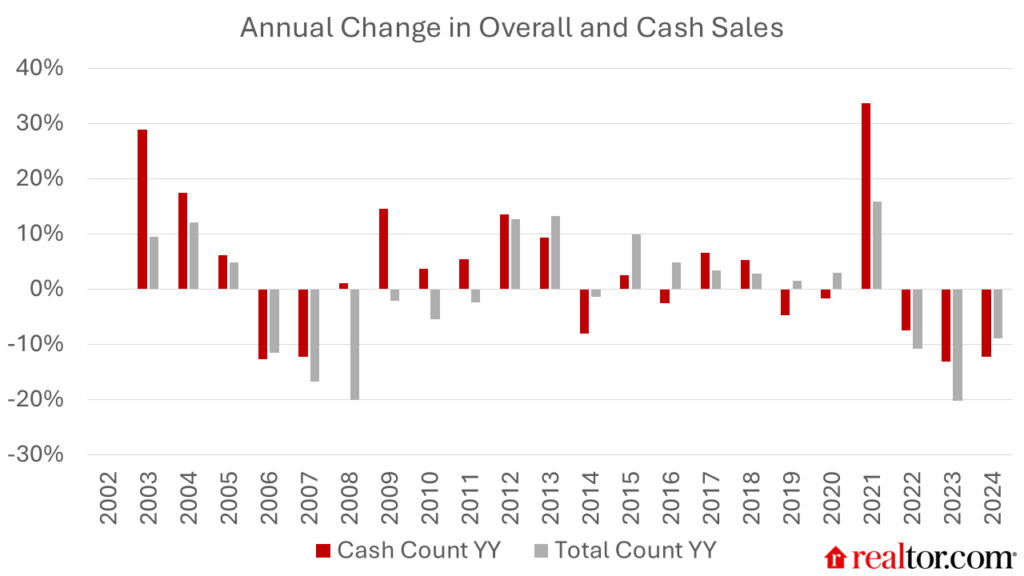
While the share of cash sales has steadily drifted lower over the past couple of years, the number of cash sales has dropped dramatically. In 2021, roughly 2 million homes were bought in cash, the highest number in the data’s history, driven by more transactions and more competition. By 2024, just about 1.4 million homes were bought in cash, the lowest number since 2016, speaking to the overall slowdown in sales. Interestingly, the count of cash sales picked up almost twice as fast between 2020 and 2021 compared to overall sales, as market demand and, as a result, competition, surged. In 2024, all-cash sales fell faster than overall home sales, likely a result of slowing competition and easing large investor activity.
Investors and second-home buyers
Investors, especially institutional players, are a key driver of cash purchases. Deed data suggests that limited liability companies and corporate entities account for a disproportionate share of cash transactions. Second-home buyers, particularly in vacation markets, also frequently buy with cash. Recent research found that the share of investors who paid all-cash in 2024 was nearly double the share of overall cash sales.
Wealthy and older buyers
High-wealth and older households are far more likely to purchase homes with cash. Many longtime homeowners can use accumulated equity from prior sales to fund their next purchase outright, avoiding the need for a mortgage. High-wealth buyers, meanwhile, often decide between paying in cash or financing based on overall financial strategy rather than mortgage rates. In other words, they’re less rate-sensitive than typical buyers, and their likelihood of paying in cash often depends on broader financial factors, such as gains in the stock market or the desire to preserve liquidity, rather than borrowing costs.
Price-tier patterns
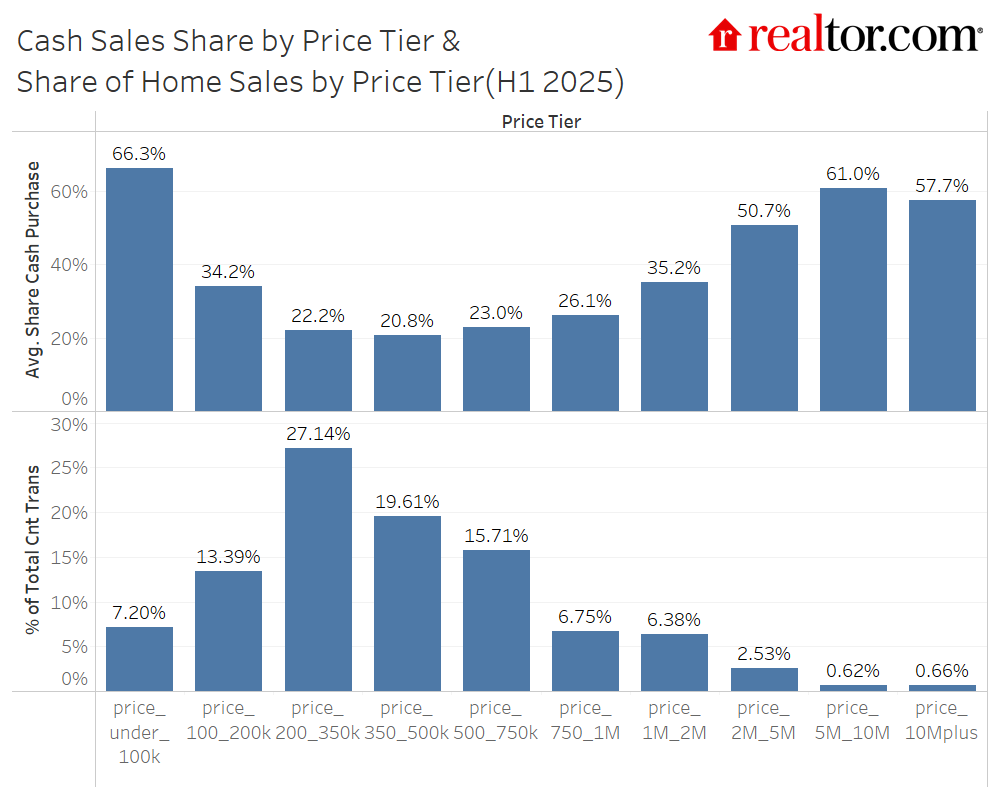
Cash purchases are common both at the high and low ends of the market. Roughly two-thirds of homes sold for under $100,000 were paid in cash, while more than 40% of homes sold for over $1 million and a majority of homes priced at $2 million or more were cash purchases.
This creates a U-shaped relationship between price and cash prevalence, suggesting wealth-driven purchases at the high end and credit/income barriers, lack of financing availability, or the presence of investors at the low end.
The vast majority of home sales occur in the middle price tiers, with 62.5% of all sales in H1 2025 occurring among homes priced between $200,000 and $750,000. This helps anchor the overall cash share of sales well below what is typical at the very high-priced and very low-priced ends of the market.
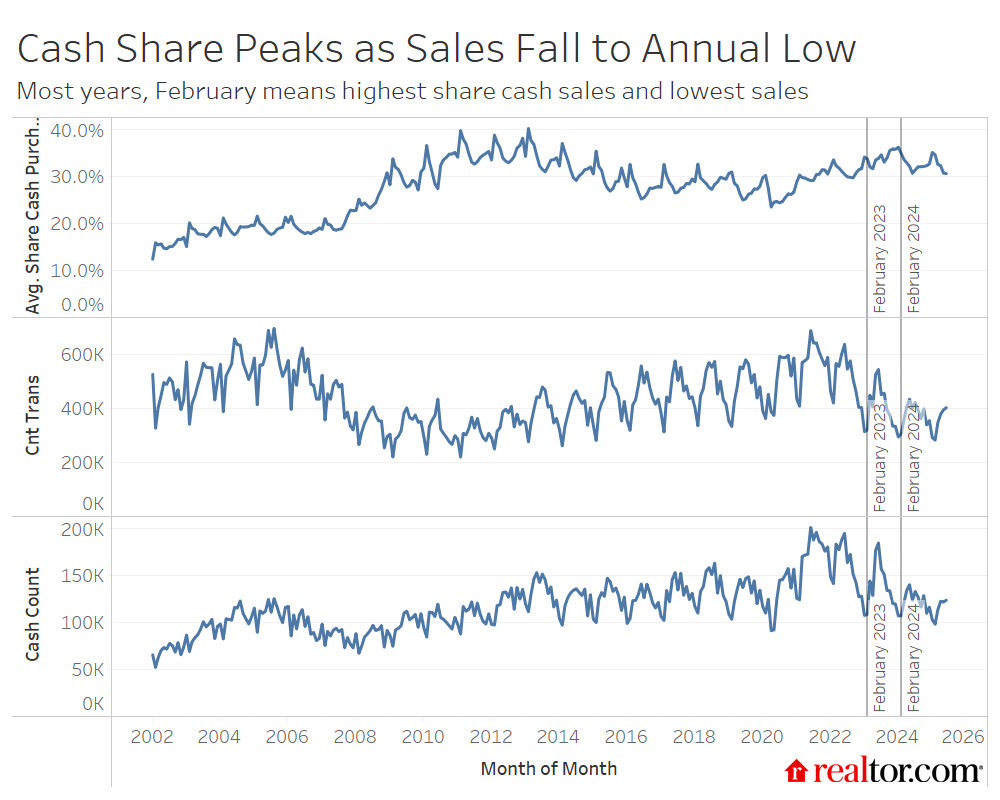
Seasonality patterns
All-cash sales tend to peak in February each year, the month when overall sales hit their lowest level for the year. This suggests that mortgage-dependent buyers, or typical buyers, pull back sharply in the winter, waiting for the spring’s warmth and new listings to reenter the market. Cash buyers also pull back in the winter, but by less than financed buyers. This relatively large pullback in noncash sales drives the overall cash share higher.
Investors and high-wealth buyers may also be more active in the “off-season” as they are less schedule-sensitive than the typical buyer and may opt to make moves when competition is lowest. Altogether, this trend means that cash buyers are more dominant during the off-season when fewer mortgage-dependent buyers are buying homes.
State- and metro-level trends
The geography of all-cash home sales reflects a blend of home prices, buyer demographics, and local market dynamics, which helps explain the sharp contrasts across states.
In the first half of 2025, Mississippi (49.6%), New Mexico (48.8%), Montana (46%), Idaho (45%), Hawaii (44.9%), and Maine (44.4%) had the highest cash shares. Mississippi is a low-cost market where modest savings or equity from a prior sale can cover a purchase outright. Limited credit access in some rural areas also encourages cash deals, and small-scale investors are active. Hawaii and Maine, by contrast, are high-cost, lifestyle-driven markets dominated by affluent out-of-state buyers and second-home purchasers who often pay in cash. Hawaii and Maine also rank first and fifth, respectively, in terms of median homeowner age, suggesting that buyers may have more home equity built up than in other states with younger populations. Idaho and Montana have seen growing popularity with out-of-state buyers, which can drive cash purchases higher.
At the other end, Washington (21.1%), Washington, DC (23.4%), Rhode Island (23.6%), Maryland (24%), and Colorado (24%) saw the lowest cash shares. These are high-cost, metro-driven markets with younger, mortgage-reliant buyers and deep lending infrastructure that keeps cash less common.
Year over year, West Virginia, New Mexico, Texas, and New York posted the largest increases in cash share, driven by low-price investor activity (West Virginia, New Mexico), wealthier in-migrants and institutional buyers (Texas), and rebounding luxury demand (New York). Hawaii, New Hampshire, and North Dakota saw the biggest drops, as luxury activity cooled in Hawaii and more mortgage-dependent buyers returned in the latter two states as affordability and inventory improved.
Metro-level trends
In the first half of 2025, Miami (43%), San Antonio (39.6%), Kansas City (39.2%), Birmingham (38.8%), Houston (38.8%), and St. Louis (38.1%) led the nation in all-cash share. These metros combine strong investor interest with either relatively affordable housing (San Antonio, Birmingham, Kansas City, St. Louis) or significant high-end, wealth-driven, and international demand (Miami, Houston). Buyers in these markets are often motivated by speed and competition, making cash offers especially effective.
San Antonio, Dallas, and Houston also saw the sharpest year-over-year gains in cash share, up 7.7, 3.5, and 2.5 percentage points, respectively, fueled by an influx of wealthier in-migrants, institutional buyers, and renewed investor activity targeting fast-growing Sun Belt metros. Growing for-sale inventory in these Texas metros opened up more opportunities for investors and other cash-rich buyers.
On the other end of the spectrum, Seattle (17.9%), San Jose (20.6%), Denver (20.7%), Virginia Beach (21.2%), Washington, DC (21.5%), and Portland (21.7%) had the lowest cash shares. These high-cost, job-centric metros are dominated by younger professional buyers who rely heavily on financing, and have well-developed mortgage lending ecosystems that keep cash purchases less prevalent. There’s considerable overlap between low cash-purchase markets and the areas where current homeowners are more likely to have a mortgage, thus making them more sensitive to mortgage rate trends.
Meanwhile, Louisville (-4%), Jacksonville (-3.1%), and Baltimore (-2.6%) saw the steepest annual declines in cash share, suggesting that improving affordability and inventory are drawing more mortgage-dependent buyers back into these markets and reducing the relative dominance of cash buyers.
Market dynamics
Cash buyers continue to shape the housing market as affordability challenges and high mortgage rates sideline many traditional buyers. First-time and lower-income households, many of whom are reliant on financing, struggle to compete with cash offers in a market where sellers prize speed and certainty. As these buyers retreat, the market skews toward high-wealth households and investors, groups far more likely to pay in cash, giving them an outsized share of a smaller pool of sales.
This influence is amplified by “inventory lock-in.” Millions of owners bought or refinanced into ultralow mortgage rates during the pandemic and are reluctant to sell, keeping listings scarce in some parts of the country. When homes do hit the market, cash buyers can move quickly, often setting the price tone for everyone else.
In many high-cash markets, out-of-state buyers and investors play a prominent role, purchasing homes for vacation use or rental income. While they bring capital, they also reduce the stock available to local residents, raising barriers to entry and reshaping local market dynamics. In this way, the dominance of cash buyers extends beyond individual sales to the broader structure of local housing markets.
What could shift the trend
If mortgage rates decline meaningfully in 2026, the balance between cash and financed buyers could shift in notable ways. Lower borrowing costs would likely draw more traditional, mortgage-dependent buyers back into the market, especially first-time purchasers who have been largely sidelined by high monthly payments and stiff competition from cash offers. As their presence grows, cash buyers would no longer represent such a dominant share of overall sales, and the cash share could begin to ease from its current elevated levels.
A more favorable financing environment could also soften the competitive edge that investors currently hold. Lower mortgage rates could enable buyers to make stronger offers, which could edge out investors not willing to raise their price. Many investors have relied on cash offers to outmaneuver financed buyers and secure properties quickly, but if mortgage rates fall enough to make financing more attractive and widely accessible again, the gap in competitiveness could narrow. However, all else being equal, in a multiple-bid scenario, all-cash offers are still likely to win out.
The return of financed buyers could inject new energy into the market, lifting transaction volumes and diversifying the buyer mix. While cash buyers would remain an important presence, particularly in the luxury segment, their influence on pricing and competition could wane as the playing field levels out.
State Data
| State | 2025 Cash Share (H1) | Year-over-year |
| Alabama | 38.7% | -0.7% |
| Alaska | 34.2% | -2.9% |
| Arizona | 32.9% | -0.8% |
| Arkansas | 28.7% | 1.4% |
| California | 24.6% | -0.5% |
| Colorado | 24.0% | -1.4% |
| Connecticut | 29.3% | -2.0% |
| Delaware | 29.4% | -1.8% |
| District of Columbia | 23.4% | -0.5% |
| Florida | 38.7% | -0.5% |
| Georgia | 31.0% | -0.3% |
| Hawaii | 44.9% | -4.0% |
| Idaho | 45.0% | -1.8% |
| Illinois | 26.3% | -0.6% |
| Indiana | 41.1% | -1.3% |
| Iowa | 30.4% | -0.7% |
| Kansas | 36.7% | -2.3% |
| Kentucky | 29.8% | -2.3% |
| Louisiana | 32.7% | 0.5% |
| Maine | 44.4% | -2.5% |
| Maryland | 24.0% | -2.4% |
| Massachusetts | 26.4% | -1.1% |
| Michigan | 31.9% | 0.3% |
| Minnesota | 25.5% | -0.5% |
| Mississippi | 49.6% | -0.8% |
| Missouri | 43.3% | -1.7% |
| Montana | 46.0% | -0.7% |
| Nebraska | 30.8% | -0.4% |
| Nevada | 29.3% | -1.1% |
| New Hampshire | 29.0% | -3.7% |
| New Jersey | 27.6% | -2.2% |
| New Mexico | 48.8% | 4.0% |
| New York | 40.9% | 2.0% |
| North Carolina | 32.9% | -1.9% |
| North Dakota | 37.7% | -3.6% |
| Ohio | 29.6% | -1.0% |
| Oklahoma | 31.8% | -2.0% |
| Oregon | 25.0% | -1.3% |
| Pennsylvania | 28.4% | -1.5% |
| Rhode Island | 23.6% | -1.5% |
| South Carolina | 33.1% | -2.8% |
| South Dakota | * | * |
| Tennessee | 34.4% | -1.7% |
| Texas | 39.6% | 2.8% |
| Utah | 35.6% | -0.7% |
| Vermont | * | * |
| Virginia | 28.0% | 0.0% |
| Washington | 21.1% | -3.1% |
| West Virginia | 32.2% | 5.3% |
| Wisconsin | 25.2% | -2.2% |
| Wyoming | 41.4% | -3.5% |
* Data omitted due to quality concerns
Metro Data
| Metro Name | Cash Share of Sales (2025 H1) | Year-over-year |
| Atlanta-Sandy Springs-Roswell, GA | 29.0% | -0.7% |
| Austin-Round Rock-San Marcos, TX | 33.6% | 0.7% |
| Baltimore-Columbia-Towson, MD | 23.3% | -2.0% |
| Birmingham, AL | 38.8% | 0.0% |
| Boston-Cambridge-Newton, MA-NH | 26.1% | -2.0% |
| Buffalo-Cheektowaga, NY | 31.0% | -1.1% |
| Charlotte-Concord-Gastonia, NC-SC | 30.9% | -2.3% |
| Chicago-Naperville-Elgin, IL-IN | 28.3% | -0.9% |
| Cincinnati, OH-KY-IN | 26.2% | -2.3% |
| Cleveland, OH | 33.2% | -0.3% |
| Columbus, OH | 25.1% | -0.6% |
| Dallas-Fort Worth-Arlington, TX | 35.9% | 3.5% |
| Denver-Aurora-Centennial, CO | 20.7% | -0.3% |
| Detroit-Warren-Dearborn, MI | 33.8% | -0.3% |
| Grand Rapids-Wyoming-Kentwood, MI | 26.2% | -0.6% |
| Hartford-West Hartford-East Hartford, CT | 27.6% | -1.0% |
| Houston-Pasadena-The Woodlands, TX | 38.8% | 2.5% |
| Indianapolis-Carmel-Greenwood, IN | 36.9% | -0.2% |
| Jacksonville, FL | 31.5% | -3.1% |
| Kansas City, MO-KS | 39.2% | -2.7% |
| Las Vegas-Henderson-North Las Vegas, NV | 28.6% | -1.3% |
| Los Angeles-Long Beach-Anaheim, CA | 26.5% | -0.5% |
| Louisville/Jefferson County, KY-IN | 26.9% | -4.0% |
| Memphis, TN-MS-AR | 34.2% | -0.9% |
| Miami-Fort Lauderdale-West Palm Beach, FL | 43.0% | -1.5% |
| Milwaukee-Waukesha, WI | 24.8% | -2.9% |
| Minneapolis-St. Paul-Bloomington, MN-WI | 24.0% | -1.5% |
| Nashville-Davidson–Murfreesboro–Franklin, TN | 31.6% | -2.1% |
| New York-Newark-Jersey City, NY-NJ | 37.2% | -0.3% |
| Oklahoma City, OK | 28.5% | -2.4% |
| Orlando-Kissimmee-Sanford, FL | 31.3% | -0.9% |
| Philadelphia-Camden-Wilmington, PA-NJ-DE-MD | 27.6% | -1.5% |
| Phoenix-Mesa-Chandler, AZ | 29.2% | -0.8% |
| Pittsburgh, PA | 24.8% | -2.5% |
| Portland-Vancouver-Hillsboro, OR-WA | 21.7% | -2.2% |
| Providence-Warwick, RI-MA | 22.6% | -1.1% |
| Raleigh-Cary, NC | 28.3% | -2.5% |
| Richmond, VA | 31.0% | 0.4% |
| Riverside-San Bernardino-Ontario, CA | 25.5% | -0.5% |
| Sacramento-Roseville-Folsom, CA | 22.4% | -1.5% |
| San Antonio-New Braunfels, TX | 39.6% | 7.7% |
| San Diego-Chula Vista-Carlsbad, CA | 23.6% | 0.1% |
| San Francisco-Oakland-Fremont, CA | 23.6% | 0.1% |
| San Jose-Sunnyvale-Santa Clara, CA | 20.6% | 1.0% |
| Seattle-Tacoma-Bellevue, WA | 17.9% | -2.1% |
| St. Louis, MO-IL | 38.1% | -1.8% |
| Tampa-St. Petersburg-Clearwater, FL | 35.0% | 0.8% |
| Tucson, AZ | 34.6% | 0.9% |
| Virginia Beach-Chesapeake-Norfolk, VA-NC | 21.2% | -1.1% |
| Washington-Arlington-Alexandria, DC-VA-MD-WV | 21.5% | -1.5% |
Methodology
This analysis uses deed records dating to 2001 to measure the prevalence of all-cash home purchases. A sale is classified as “all-cash” when the recorded transaction shows no evidence of a mortgage lien at closing. Shares are calculated as the number of all-cash transactions divided by the total number of home sales in a given geography and time period. Results are reported at the national, state, and metro levels and are aggregated by calendar year or half-year for trend comparability. Historical benchmarks (2001–present) allow for analysis of long-term patterns, including the post-recession peak, pre-pandemic baseline, and recent shifts in cash activity.