
- WTI snaps a two-day losing streak, key resistance sits at $65.
- Price reclaims 21-day EMA, technical momentum improves as RSI turns neutral.
- Iran nuclear deal prospects and OPEC+ supply strategy weigh on broader bullish sentiment.
West Texas Intermediate (WTI) crude oil is trading around $62 on Friday ahead of the weekend, staging a modest rebound after snapping a two-day losing streak. The US Oil found renewed buying interest following a retest of the $55 support zone, where a potential double-bottom structure has formed on the daily chart. While the short-term technical picture has improved, macroeconomic and geopolitical headwinds, especially surrounding rising Organisation of the Petroleum Exporting Countries (OPEC+) output and the potential return of Iranian barrels, continue to weigh on sentiment.
OPEC+ supply strategy and Iran talks cloud the outlook
OPEC+’s recent move to raise production has introduced fresh downside risks to oil markets. Saudi Arabia and key allies are growing less willing to carry the burden of cuts alone, and the group has warned that all voluntary reductions—totaling 2.2 million barrels per day (bpd)—could be unwound by Q4 of 2025 if quota discipline doesn’t improve.
Meanwhile, renewed hopes of a United States (US)–Iran nuclear deal are capping oil’s rebound. Diplomats suggest progress has been made, and analysts estimate a deal could bring back as much as 800,000 bpd of Iranian supply. These developments have reintroduced a bearish overhang as the market attempts to stabilize.
Technical outlook: WTI holds above short-term key support, but $65 remains the line in the sand
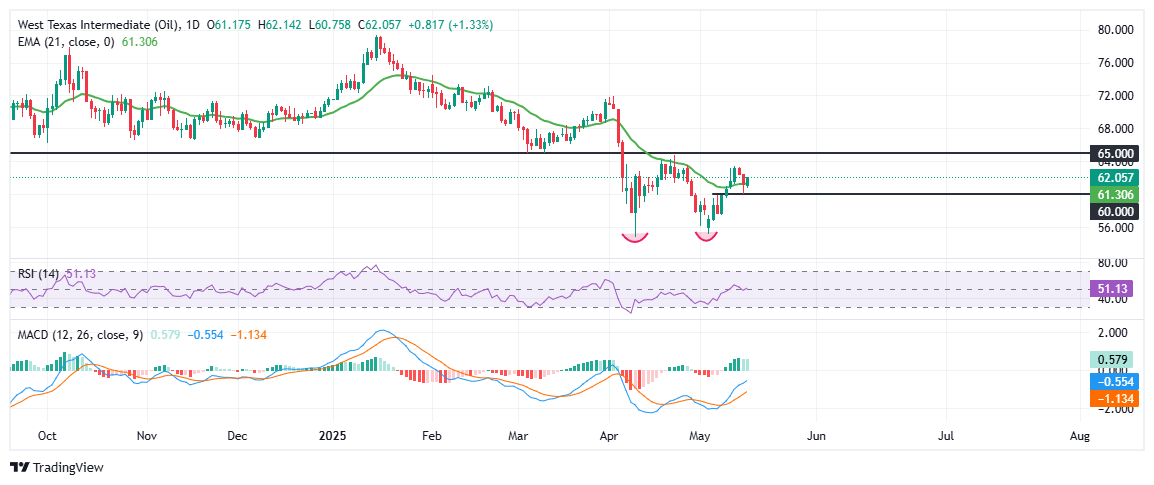
Technically, WTI has managed to stay afloat above the $60 psychological level, while defending the $55 double-bottom base—a zone that marks the lowest levels since 2021. The daily chart shows the price reclaiming the 21-day Exponential Moving Average (EMA) at $61.29, a short-term bullish signal. The Relative Strength Index (RSI) has moved up to 50.70, while the Moving Average Convergence Divergence (MACD) histogram has turned positive, indicating a mild recovery in bullish momentum.
That said, upside remains limited near the $65 handle, which aligns with previous support-turned-resistance and the April breakdown zone. A daily close above $65 would be required to confirm a broader trend reversal. Failure to do so could keep WTI stuck in a $55–$65 consolidation range. Traders will closely watch for fresh headlines on Iran, OPEC+ policy shifts, and macro data to drive the next directional move.
Information on these pages contains forward-looking statements that involve risks and uncertainties. Markets and instruments profiled on this page are for informational purposes only and should not in any way come across as a recommendation to buy or sell in these assets. You should do your own thorough research before making any investment decisions. FXStreet does not in any way guarantee that this information is free from mistakes, errors, or material misstatements. It also does not guarantee that this information is of a timely nature. Investing in Open Markets involves a great deal of risk, including the loss of all or a portion of your investment, as well as emotional distress. All risks, losses and costs associated with investing, including total loss of principal, are your responsibility. The views and opinions expressed in this article are those of the authors and do not necessarily reflect the official policy or position of FXStreet nor its advertisers. The author will not be held responsible for information that is found at the end of links posted on this page.
If not otherwise explicitly mentioned in the body of the article, at the time of writing, the author has no position in any stock mentioned in this article and no business relationship with any company mentioned. The author has not received compensation for writing this article, other than from FXStreet.
FXStreet and the author do not provide personalized recommendations. The author makes no representations as to the accuracy, completeness, or suitability of this information. FXStreet and the author will not be liable for any errors, omissions or any losses, injuries or damages arising from this information and its display or use. Errors and omissions excepted.
The author and FXStreet are not registered investment advisors and nothing in this article is intended to be investment advice.