
Euro Stoxx 50 Elliott Wave analysis – Daily chart
Overview
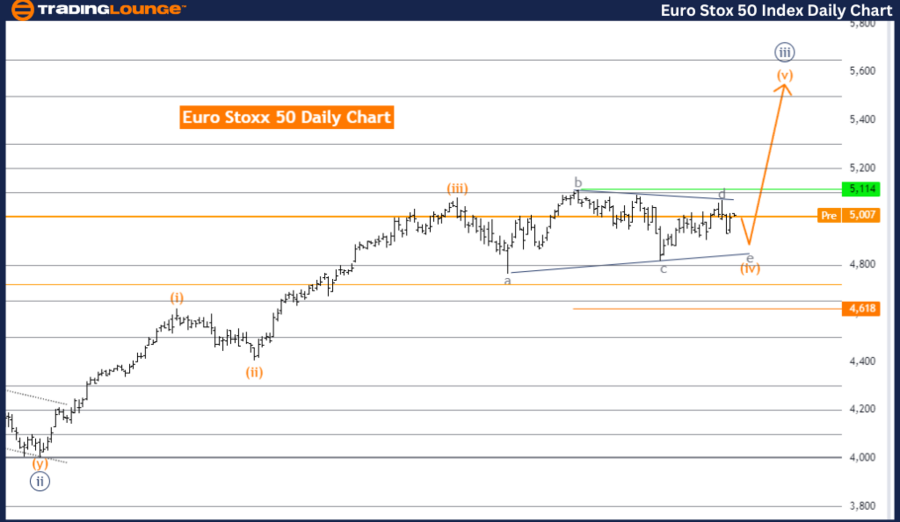
The Euro Stoxx 50 Elliott Wave analysis on the daily chart focuses on a counter trend within a corrective mode.
Trend identification
-
Function: Counter Trend.
-
Mode: Corrective.
-
Structure: Orange wave 4.
-
Position: Navy blue wave 3.
Current analysis
-
Details: Orange wave 4 is still in play as a sideways movement.
-
Invalidation Level: 4618.
Key points
- Corrective Counter Trend: The analysis identifies the trend as corrective, indicating a consolidation phase against the main trend.
- Wave Structure: The focus is on orange wave 4 within the Elliott Wave structure. The current position is within navy blue wave 3, indicating a corrective phase.
- Next Phase: The next expected phase in the wave structure is orange wave 5, which may resume the primary trend or continue the correction.
Detailed analysis
- Sideways Movement: Orange wave 4 is characterized by sideways movement, indicating a lack of clear directional bias and range-bound market behavior.
- Wave 4 Characteristics: The ongoing orange wave 4 signifies a period of fluctuation without a strong upward or downward trend.
- Invalidation Level: The wave cancel invalid level is set at 4618. If the market price surpasses this level, the current wave analysis would be invalid, indicating a significant market shift.
Conclusion
The Euro Stoxx 50 daily chart analysis identifies a counter trend within the Elliott Wave framework. The market is currently in the corrective phase of orange wave 4 within navy blue wave 3, marked by sideways movement. This phase is ongoing, with the next phase being orange wave 5. The invalidation level at 4618 is crucial for confirming the current wave structure.
Euro Stoxx 50 Elliott Wave analysis – Weekly chart
Overview
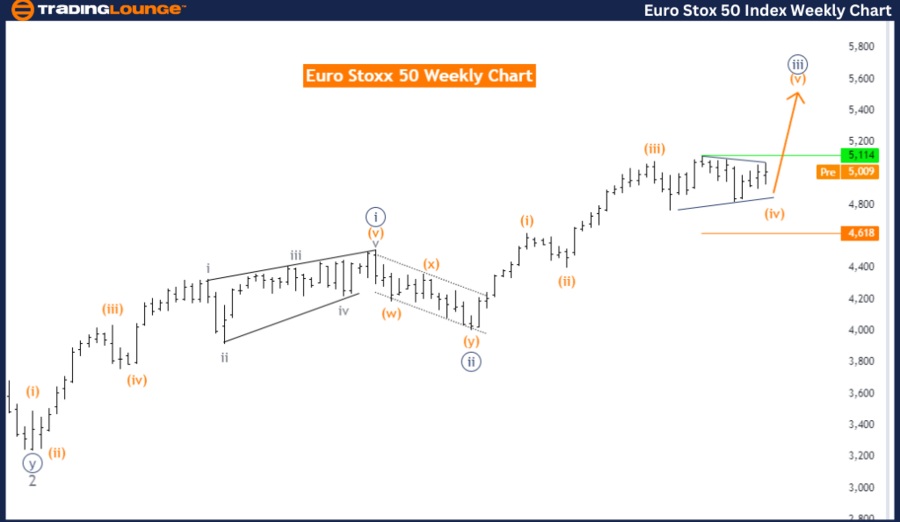
The Euro Stoxx 50 Elliott Wave analysis on the weekly chart focuses on a strong trend within an impulsive mode.
Trend identification
-
Function: Trend.
-
Mode: Impulsive.
-
Structure: Navy blue wave 3.
-
Position: Gray wave 3.
Current analysis
-
Details: Navy blue wave 3 is currently in play.
-
Invalidation Level: 4618.
Key points
- Impulsive Trend: The analysis identifies the trend as impulsive, indicating strong directional movements.
- Wave Structure: The focus is on navy blue wave 3 within the Elliott Wave structure, positioned within gray wave 3, suggesting a robust upward trend.
- Next Phase: The next expected phase in the wave structure is navy blue wave 4, which typically represents a corrective phase.
Detailed analysis
- Navy Blue Wave 3: This wave is characterized by strong upward movement, indicative of a robust market trend.
- Next Expected Phase: Navy blue wave 4 is anticipated to follow, marking a corrective phase with possible retracement against the prevailing trend before resuming the upward movement.
- Invalidation Level: The wave cancel invalid level is set at 4618. If the market price surpasses this level, the current wave analysis would be invalid, indicating significant market changes.
Conclusion
The Euro Stoxx 50 weekly chart analysis highlights an impulsive trend within the Elliott Wave framework. The market is currently in the upward phase of navy blue wave 3 within gray wave 3, showing strong bullish momentum. The next phase is expected to be navy blue wave 4, involving a corrective retracement. The invalidation level at 4618 is critical for confirming the current wave structure.
Euro Stoxx 50 Elliott Wave technical analysis [Video]
As with any investment opportunity there is a risk of making losses on investments that Trading Lounge expresses opinions on.
Historical results are no guarantee of future returns. Some investments are inherently riskier than others. At worst, you could lose your entire investment. TradingLounge™ uses a range of technical analysis tools, software and basic fundamental analysis as well as economic forecasts aimed at minimizing the potential for loss.
The advice we provide through our TradingLounge™ websites and our TradingLounge™ Membership has been prepared without considering your objectives, financial situation or needs. Reliance on such advice, information or data is at your own risk. The decision to trade and the method of trading is for you alone to decide. This information is of a general nature only, so you should, before acting upon any of the information or advice provided by us, consider the appropriateness of the advice considering your own objectives, financial situation or needs. Therefore, you should consult your financial advisor or accountant to determine whether trading in securities and derivatives products is appropriate for you considering your financial circumstances.