XLM advanced 2.5% over 24 hours, breaking above key resistance on a 350% volume spike before easing into consolidation near $0.321, maintaining its broader uptrend structure.
Updated Oct 24, 2025, 4:08 p.m. Published Oct 24, 2025, 4:08 p.m.
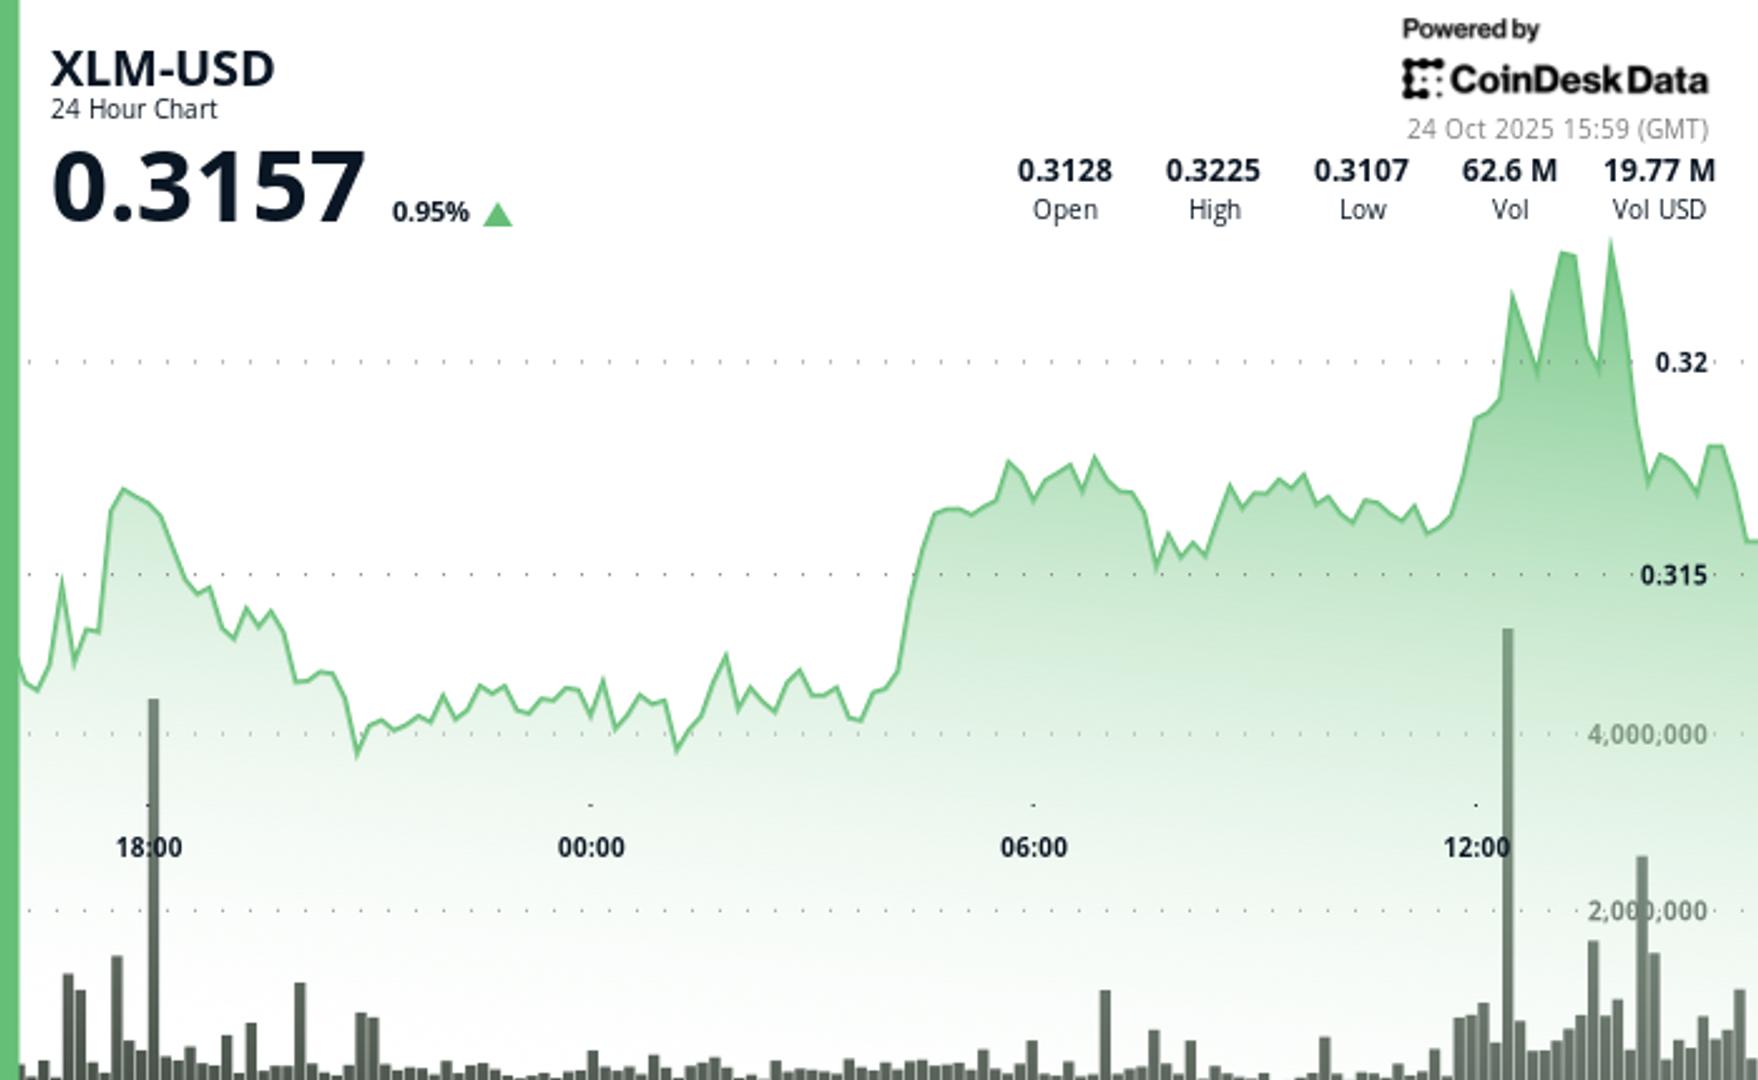
Stellar’s native token, XLM, climbed from $0.3131 to $0.3210 over the past 24 hours, advancing 2.5% and confirming an ascending trend pattern. The rally was supported by a series of higher lows at $0.3106, $0.3118, and $0.3149, reflecting consistent buying momentum across sessions.
At midday UTC on Oct. 24, trading activity surged sharply, with volume spiking to 74.39 million—roughly 350% above the 24-hour average—pushing XLM to a session high of $0.3229. The move confirmed a bullish breakout above the $0.3170 level before encountering resistance at $0.3230. Support held near $0.3150, defining the day’s trading range of $0.0133, or about 4.2% in volatility.
Short-term charts show the token easing from its peak, dipping 0.6% to $0.321 as volume exceeded 2.9 million during key distribution phases. The pullback formed a descending triangle pattern, suggesting short-term profit-taking rather than a shift in overall momentum.
With no major fundamental catalysts driving the move, technical signals remain in focus. The volume surge underscores institutional participation, while the pullback to the 38.2% Fibonacci retracement near $0.321 points to a potential base formation. Maintaining this level could position XLM for a continuation higher if buying volume resumes.

Key Technical Levels Signal Consolidation for XLM
Support/Resistance Analysis
- Primary resistance confirmed at the $0.3230 level with strong selling pressure.
- Key support established near $0.3150 from previous consolidation phases.
- Immediate support formed at $0.321 from recent base formation patterns.
Volume Analysis
- Exceptional 74.39M volume spike provided breakout confirmation above $0.3170.
- Distribution volume of 2.9M+ during pullback indicated professional profit-taking.
- Volume patterns suggested institutional participation during key price levels.
Chart Patterns
- Ascending trend structure with higher lows at $0.3106, $0.3118, and $0.3149.
- Descending triangle formation observed during pullback with a sequence of lower highs.
- 38.2% Fibonacci retracement alignment supported the base formation thesis.
Targets & Risk Management
- Upside target aimed toward $0.3230 resistance on volume expansion above $0.3170.
- Downside risk contained above $0.3150 support to maintain trend structure.
- Risk/reward favors continuation given strong volume confirmation and retracement levels.
Disclaimer: Parts of this article were generated with the assistance from AI tools and reviewed by our editorial team to ensure accuracy and adherence to our standards. For more information, see CoinDesk’s full AI Policy.
More For You

Stablecoin payment volumes have grown to $19.4B year-to-date in 2025. OwlTing aims to capture this market by developing payment infrastructure that processes transactions in seconds for fractions of a cent.
More For You
XRP Leads Gains on Ripple Moves, Bitcoin Holds $111K as ‘Uptober’ Dud Heads for Last Week

October has been defined by forced selling and false starts and on track to become the worst since 2015, dampening an otherwise bullish month that averages over 25% returns for bitcoin.
What to know:
- Bitcoin remained stable above $110,000, showing resilience after a significant liquidation event in October.
- Ether and Solana led gains among major cryptocurrencies, with Solana attracting institutional interest as a risk sentiment proxy.
- Market sentiment is cautious, with traders opting for selective exposure amid ongoing macroeconomic volatility.